-
-
Access Free Student Software
Ansys empowers the next generation of engineers
Students get free access to world-class simulation software.
-
Connect with Ansys Now!
Design your future
Connect with Ansys to explore how simulation can power your next breakthrough.
Free Trials
Products & Services
Learn
About
Back
Products & Services
Back
Learn
Ansys empowers the next generation of engineers
Students get free access to world-class simulation software.
Back
About
Design your future
Connect with Ansys to explore how simulation can power your next breakthrough.
Free Trials
ANSYS BLOG
April 2, 2021
How to Quiet Drones With Acoustics Simulation
What’s that buzzing? As drones gain momentum in the commercial space, the noise they make has become more of an issue. Companies are investigating the use of drones for package delivery, military reconnaissance, emergency services, environmental monitoring, media coverage and much more. As drone use increases in urban and suburban areas, engineers are turning to simulation to analyze and reduce the noise they create.
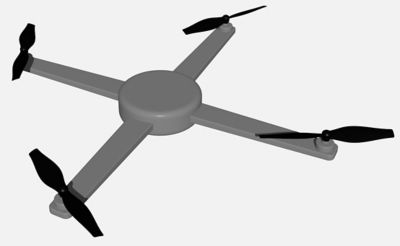
A quadcopter drone model that was developed as a demonstration case.
Drone noise is affected by many factors, including:
- Motor size and mounting
- Propeller diameter, shape and rotational speed
- Drone body shape
- Operating environment
Ansys has developed a streamlined solution to predict both the unsteady flow field generated by a drone in flight and the aerodynamically generated noise from the rotating propellers by combining the power of computational fluid dynamics (CFD) simulation and advanced acoustic analysis techniques.
In the latest Ansys software release, 2021 R1, we have introduced a new acoustics workflow that couples Ansys Fluent CFD simulations to Ansys VRXPERIENCE Sound, which enables engineers to use advanced acoustics analysis techniques to analyze the acoustic pressure signals computed by CFD.
VRXPERIENCE Sound capabilities include:
- Generation of sound files (.wav) based on CFD-generated sound pressure signals, which allows you to listen to the simulated sounds.
- Built-in calculation of psychoacoustics indicators, with a complete report on such metrics as loudness, tonality, sharpness and articulation index.
- The ability to employ acoustic transfer functions, which allow you to translate a pressure signal computed at one location to see the acoustic indicators at another location.
Setting up the CFD Simulation for Aeroacoustics
The quadcopter drone model shown in the figure above was developed as a demonstration case. Each propeller revolves in a sliding mesh zone at a fixed rotational speed, with the rotation directions set up based on the counter-rotating orientation seen in most quadcopter drones. For this analysis, it was assumed that the drone was in hover mode 10 meters above an observer.
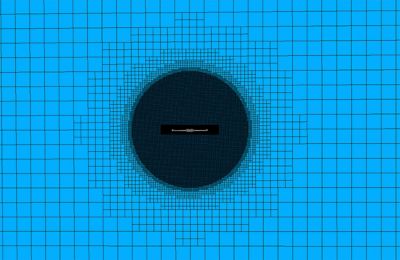
A 16-million cell mesh generated in Ansys Fluent with bodies of influence to accurately capture drone noise.
The drone geometry was brought into Fluent Meshing to generate a 16-million cell Mosaic enabled poly-hexcore mesh with bodies of influence used to refine regions close to the body and propellers. These refinement regions helped to increase the resolution of the unsteady flow field in the vicinity of the propeller, motor and motor mounts.
A transient CFD simulation was set up as a compressible, unsteady, turbulent flow in Fluent. Turbulence was modeled using a hybrid LES/RANS model to capture the fine scale flow field structures in the vicinity of the rotating propellers. As shown in the figure below, interaction of the propeller with the drone structure and motor mounts generates pressure “pulses,” which are one of the main contributors of noise generation from the drone.
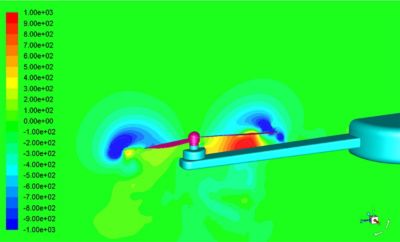
Instantaneous static pressure simulation showing a large pressure pulse resulting in a noise signature.
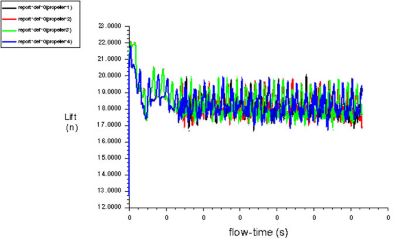
The Ffowcs Williams-Hawkings (FW-H) acoustic analogy model was used and the lower mesh interfaces near the propellors were defined as source surfaces. Ten different receiver locations were defined to analyze the noise from different locations below the drone. After the transient solution was carried out to allow the turbulent flow field to reach a statistically steady condition (as seen in the Lift history plot), the model was set up to collect acoustic pressure data at source surfaces near each propeller. This data was stored for later acoustic post-processing within Fluent.
Analyzing Aeroacoustics to Predict Drone Noise
Overall sound pressure levels (OASPL) were computed for each receiver location in the CFD model and are shown in the table. Variations in OASPL were observed, indicating that a ground observer would hear differences in the drone noise level depending on their position relative to the drone.
| Receiver | OASPL (dB) |
|---|---|
| 1 | 81.84 |
| 2 | 87.85 |
| 3 | 79.94 |
| 4 | 79.46 |
| 5 | 78.49 |
| 6 | 79.47 |
| 7 | 81.48 |
| 8 | 81.86 |
| 9 | 79.97 |
| 10 | 78.08 |
A more detailed analysis of the sound pressure level (SPL) is shown in the spectral plot for one of the observer positions. You can see that the sound contains a strong blade passing frequency component along with a higher harmonic. These dominate the noise signature versus the higher frequency broadband noise. This is consistent with a casual observation of drone noise as you hear the prominent “buzzing” tones from a drone’s propellers as it flies overhead.
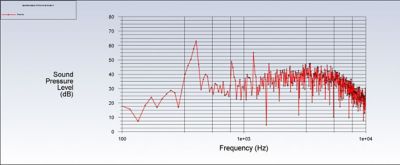
An analysis of the sound pressure level (SPL) is shown in this spectral plot for one of the observer positions.
Spectral plots like this can be turned into real sound files using the VRXPERIENCE Sound acoustic analysis tool inside Fluent. In addition, the psychoacoustic analysis tools can provide insight into the impact of the predicted sounds on observers close to the drone’s flight path. For example, you can determine how “loud” the sound is and how “harsh” the noise spectrum is perceived by an observer at a given position.
To learn more about the newest acoustics enhancements and see how they can be used for your simulation, view the webinar: Listen to Your Aeroacoustics Simulations, or visit the CFD Simulation product page.