-
-
Access Free Student Software
Ansys empowers the next generation of engineers
Students get free access to world-class simulation software.
-
Connect with Ansys Now!
Design your future
Connect with Ansys to explore how simulation can power your next breakthrough.
Free Trials
Products & Services
Learn
About
Back
Products & Services
Back
Learn
Ansys empowers the next generation of engineers
Students get free access to world-class simulation software.
Back
About
Design your future
Connect with Ansys to explore how simulation can power your next breakthrough.
Free Trials
ANSYS BLOG
August 10, 2022
Hear That? Tonality in Product Design
When designing a product, a lot of thought goes into how it will work. But what about how it will sound? A squealing hairdryer, whistling laptop, or buzzing electric car would quickly be rejected by consumers. To improve the sound quality of their products, engineers analyze a variety of sound metrics, including the measure of frequency components in the overall sound — or tonality.
What is Tonality?
Tonality, or tonalness, is a psychoacoustic indicator that identifies emerging tones over background noise to determine their contribution in the perception of a sound. The tonality of an acoustic source is one of the main metrics generally looked at to improve the sound quality of a product, together with loudness, sharpness, roughness, and fluctuation strength.
Quantifying tonality means translating how “tonal” a sound is perceived by the human ear into objective metrics. In industrial applications, such as automotive, aeronautics, railway, or consumer goods, tonality expresses the relative weight of the tonal components over their surrounding frequency contents.
Tonality Example: Two Airplanes
To understand how tonality affects what we hear, listen to the difference in tonal scale between these two airplanes.
Airplane 1
Airplane 2
In both files, you can hear the blade passing frequency (BPF) caused by the turbines. This corresponds to the turbine rotational speed multiplied by the number of blades. You’ll notice that airplane two sounds more tonal than airplane one. This is because it contains frequencies emerging from the rest of the sound. When a tonal sound is highly perceivable, simply put, it’s annoying.
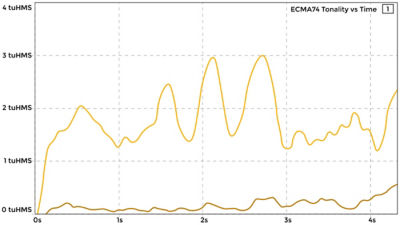
Psychoacoustic tonality versus time calculated with Ansys Sound.
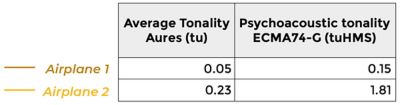
Average Aures and psychoacoustic tonality calculated with Ansys Sound.
The BPF itself, and the surrounding noise, will have an influence on our perception of the tonal content. The more energy around the emerging frequency, the less perceivable the frequency will be and therefore the less tonal the sound.
Tonality in Psychoacoustics
Several psychoacoustic indicators are commonly used to calculate the tonality of acoustic signals, with international standard calculation methods:
TONALITY INDICATOR | UNIT | STANDARD |
Prominence Ratio (PR) | dB (decibels) | |
Tone-to-Noise Ratio (TNR) | dB | |
Tonal Audibility | dB | |
Tonal Adjustment Kt ISO 1996-2 | dB | |
Tonal Adjustment Kt DIN45681 | dB | |
Aures Tonality | tu (tonality unit) | Aures' model |
Psychoacoustic Tonality | tuHMS (Hearing Model of Sottek) |
Note: In Ansys Sound software, for each of these psychoacoustic indicators, the computation profile includes an automatic tone detection procedure.
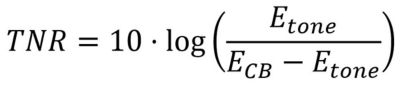
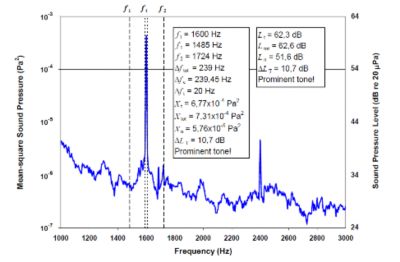
For instance, the tone-to-noise ratio (TNR) is the energy ratio between a tone and the noise critical band (CB) centered on it:
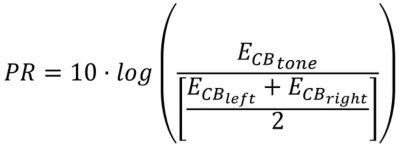
The prominence ratio (PR) is the energy ratio between the critical band around the tone and the two closest ones:
Simulating Tonality
Assessing tonality is critical in a wide variety of applications, such as electric motors, HVAC systems, and construction machinery. But in these complex systems, identifying the single source of a sound can be incredibly difficult. To break noises into different sources and analyze how they each affect the overall sound of the system, engineers can use Ansys Sound to simulate and test data.
Fan Noise Simulation
In this example, engineers used Ansys Fluent and Sound to improve the sound quality of a fan. The computational fluid dynamic (CFD) simulation performed by Fluent made sure the fan was designed properly, while Sound made sure the noise from the fan was as it should be.
To predict the influence of design on the sound quality of the fan, the second fan was given a modified design with twisted blades. Modifying the design divided the tonality by about 3 tu according to both Aures and ECMA74 models. For theTNR, only the 260 Hz tone emerged in the modified design. Through this simulation, engineers confirmed that changing the shape of the blades would reduce the tonal content of the noise and therefore improve the overall sound quality.
Listen to how changing the shape of fan blades can improve sound quality.
E-motor Noise Simulation
Another example where tonality can negatively affect the user experience is electric motors.
Electric motor noises can be annoying due to the high-pitched tones from the rolling and aerodynamic noise. Those tones, which evolve relatively to the speed of the motor, are called “orders.”
Thanks to Sound, the tonality can be computed looking at the TNR or the PR of the orders generated by the e-motor. This shows two strong tonal emergences of order 48 and order 60, which would likely be annoying to the driver and the passengers.
Ansys Sound can be used to simulate electric motor tonality (left) and internal combustion engines (above). Click the images to listen.
Setting the Right Tone
To design products that meet standards for sound quality and create auditory experiences customers will enjoy, analyzing and addressing noise sources is critical. Through acoustics simulation and acoustic metrics like tonality, engineers can identify every squeak, buzz, and whistle, and explore options to create the ideal sound for their project. Learn more about getting started with Ansys Acoustics software with your Ansys Learning Hub account.