-
-
Access Free Student Software
Ansys empowers the next generation of engineers
Students get free access to world-class simulation software.
-
Connect with Ansys Now!
Design your future
Connect with Ansys to explore how simulation can power your next breakthrough.
Free Trials
Products & Services
Learn
About
Back
Products & Services
Back
Learn
Ansys empowers the next generation of engineers
Students get free access to world-class simulation software.
Back
About
Design your future
Connect with Ansys to explore how simulation can power your next breakthrough.
Free Trials
ANSYS BLOG
June 21, 2023
How to Design a Quiet Motor
With the onset of electric vehicles (EVs), noise and vibrational analysis of the electric motor has become a very important part of the design of electric powertrains. The electric traction motor is now the only propulsion component in an EV, and its noise is no longer masked by an engine. So, it is crucial to design a quiet motor, as any unwanted motor whine would cause unpleasant noise and vibration to the driver. However, reducing unwanted motor noise is by no means limited to electric traction motors. In many other motor applications such as industrial drives, HVACs and wind turbines, reducing motor noise and vibration are important design aspects.
How Noisy is My Motor Design?
Noise and vibration are caused by a combination of excitations — electromagnetic forces generated by the motor — and the structural dynamics of the motor, i.e., the natural frequencies of the structure. An unlucky combination leads to high-pitched whining, which is typically caused by a high excitation force aligning with a dominant natural frequency of the motor structure.
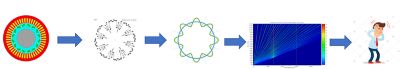
Figure 1. Motor whine is often caused by high excitation force aligning with a dominant natural frequency of the motor structure.
We can demonstrate how to assess the noise levels in an electric motor with an example. A typical automotive traction motor is shown below. This is an interior permanent magnet (IPM) motor topology with eight poles and 48 slots.
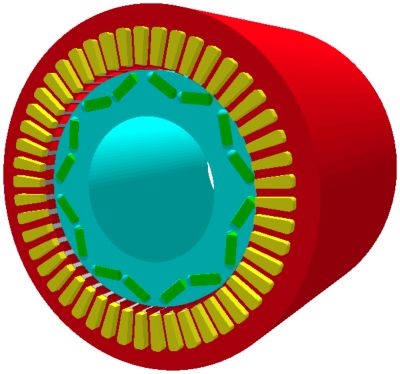
Figure 2. A typical automotive traction motor.
An easy way of assessing what frequencies at which we are likely to get peaks in the acoustic response is by means of a Campbell diagram. This diagram shows the dominant excitation frequencies (orders) as diagonal lines with a linear relationship between frequency and rotating speed. The natural frequencies of the stator structure of the electric motor are shown as vertical lines.
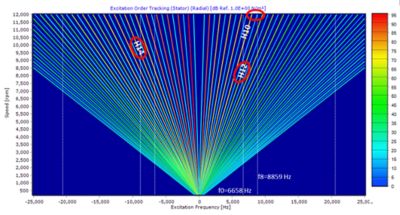
Figure 3. The Campbell diagram.
Peaks in the noise typically occur where lines intersect, meaning that at that frequency, the electromagnetic force excites a structural mode of the stator. For our example, the most important structural modes are F0 — a breathing mode excited by the average force around the stator changing over time — and F8, an octahedral mode excited by the fundamental forcing frequency due to the motor having eight poles.
A spectrogram shows the acoustic response for each frequency order. Where the frequency order crosses a natural frequency, the amplitude of the acoustic response, or sound power, is maximum, as shown in the spectrogram below.
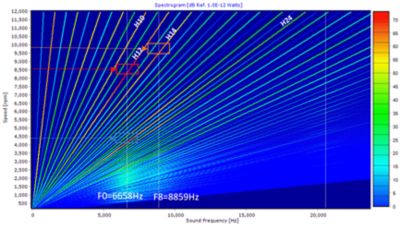
Figure 4. Where the frequency order crosses a natural frequency, the amplitude of the acoustic response, or sound power, is maximum.
By taking a cross-section of each dominant order — a so-called “order cut” — we can plot the acoustic sound power as a function of the operating speed of the motor. This enables us to identify at which speeds/frequencies the largest response occurs.
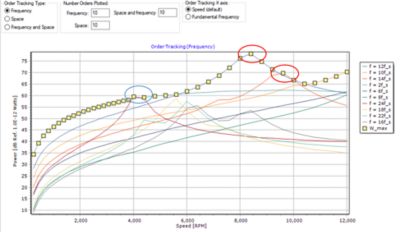
Figure 5. Graph identifying which speeds/frequencies elicit the largest response.
How and When to Improve a Design to Reduce Noise
The design of electric motors is a complex process involving multiple physical domains. A motor designer needs to assess how noisy their design is early in the design process, when changes can easily be made. For this, a motor designer needs access to a fast noise, vibration, and harshness (NVH) analysis tool during the concept design of their electric motors. A motor designer would likely look to reduce the electromagnetic excitations, but the example below shows that it is very important to consider the acoustic response of the motor to these excitations if we want to reduce noise.
For our example motor, the highest peaks in the acoustic response occur at 8,400 rpm and 9,600 rpm. From the spectrogram, we can clearly see that at these speeds, a peak occurs as the 12th and 14th harmonic orders cross the natural frequencies of the stator structure (F0 and F8).
A 2D fast Fourier transform (FFT) analysis of the radial force excitations shows that the biggest noise response for our example motor comes from three small excitations highlighted in the plot below. The reason these small harmonics generate such a large response is because the stator structure is more flexible for these particular shape and frequency orders.
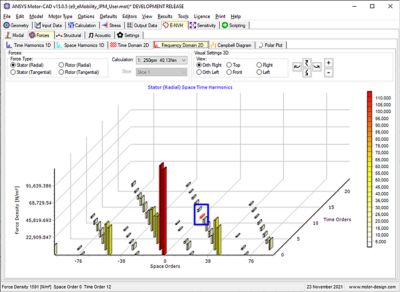
Figure 6. Stator space time harmonics.
This highlights the importance of an approach that combines forcing and response, which enables engineers to rapidly evaluate noise and vibration from the early stages of the design process. If we were focused only on reducing electromagnetic excitations, we wouldn’t worry about these small excitations; however, these are key to the noise generated by this motor. In this case, to reduce the noise, we can focus on reducing the stator response rather than further reducing the already small excitations.
The stator response is defined by the modal behaviour of the stator structure, which is determined by its dimensions and materials. One way of reducing stator response is by thickening the stator back iron, which increases its stiffness and natural frequencies. This will reduce the noise amplitude at resonance peaks and increase the motor speed at which resonance occurs. Ideally, we will increase this speed until the resonance occurs above the motor’s maximum operating speed.
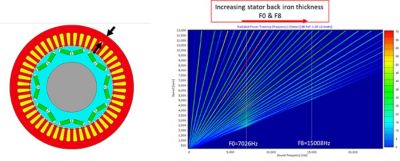
Figure 7. Increasing stator back iron thickness reduces noise.
For our example, the increase in the stator back iron thickness of the electric motor means the frequencies of structural modes F0 and F8 shift to the right. Comparing the resulting response shows a reduction in the resonance peak caused by the 12th harmonic by 4 decibels (dB). This is due to increasing the stator stiffness for the structural mode F0. The resonance peak due to the 14th harmonic has disappeared completely, as it no longer crosses structural mode F8.
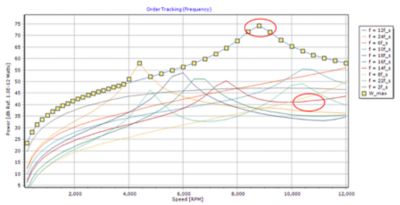
Figure 8. Resonance peak reduction.
The NVH analysis tools shown above are the latest additions to Ansys Motor-CAD. Motor-CAD is the dedicated software for electric motor design. It provides fast and accurate design and analysis tools that include all major physics, e.g., electromagnetic, thermal, mechanical, and now NVH. The NVH analysis tool uses a combination of finite element analysis (FEA) and analytical methods so simulation times are kept short. This enables a motor designer to bring NVH analysis into their multiphysics concept design and make design changes to avoid noise issues early on.
Request your 30-day free trial of Ansys Motor-CAD to access to all the multiphysics simulation tools needed to minimize noise in your next motor design.