Synopsys and Ansys power the future of innovation—connecting silicon to systems.
-
-
Access Free Student Software
Ansys empowers the next generation of engineers
Students get free access to world-class simulation software.
-
Connect with Ansys Now!
Design your future
Connect with Ansys to explore how simulation can power your next breakthrough.
Free Trials
Products & Services
Learn
About
Back
Products & Services
Back
Learn
Ansys empowers the next generation of engineers
Students get free access to world-class simulation software.
Back
About
Design your future
Connect with Ansys to explore how simulation can power your next breakthrough.
Free Trials
TOPIC DETAILS
What is Overall Equipment Effectiveness?
Overall equipment effectiveness (OEE) is a manufacturing metric that measures the performance of a process or piece of equipment. Instead of focusing solely on downtime, the OEE score shows engineers and management the combined availability, performance, and quality of a manufacturing process or machine. A perfect 100% OEE score means the system under measurement is making acceptable parts as quickly as possible, with no stop time.
Developed in the 1960s by Seiichi Nakajima as part of total productive maintenance (TPM), OEE has evolved as a tool stakeholders can use to identify issues and then track the effectiveness of solutions. Originally a metric calculated by floor managers on a monthly or quarterly basis, the OEE calculation can now be computed instantaneously using real-time industrial Internet of Things (IIoT) monitoring.
Some of the more common benefits of integrating OEE into a factory's quality management processes include:
- Increased efficiency: OEE is a useful way to identify inefficiencies while also serving as a useful maximization goal for optimization efforts.
- Reduced cost: Minimizing downtime, rework, and scrap lowers expenditures.
- Improved productivity: Higher OEE scores indicate improved quality, uptime, and production, all measures of productivity.
- Informed decision making: Inputs to the OEE score and the score itself provide actionable insights for engineers, planners, and managers.
- Enhanced equipment longevity and reliability: Since uptime is a key component of overall equipment effectiveness, it drives teams to improve equipment service life and reliability through proactive maintenance practices.
How to Calculate Overall Equipment Effectiveness
The OEE score for equipment is calculated by multiplying the calculated scores for availability, performance, and quality. The OEE formula is defined below.
OEE = Availability * Performance * Quality
Where the components of OEE are defined as the following.
Availability Score
Availability is a measure of how the actual production time compares to the expected equipment availability. Availability losses include equipment breakdowns, material shortages, and planned stops.
Availability = Run Time / Planned Production Time
Performance Score
Performance is a measure of how fast the equipment is running compared to its maximum possible speed, or ideal cycle time. The ideal cycle time is the time it takes to make a part with no slowdown or minor stops. A low performance score can result from slower running speeds due to machine settings, material issues, worn tooling, or inattentive operators. Minor stops from sensor stops, misfeeds, or jams can also lower the performance score. The total count is the number of parts made during the measurement period.
Performance = (Ideal Cycle Time * Total Count) / Run Time
Quality Score
Quality measures how many of the manufactured parts are good parts in addition to parts that are not reworked or scrapped.
Quality = Good Count / Total Count
With a little bit of algebra, the OEE measurement rearranges to:
OEE = (Good Count * Ideal Cycle Time) / Planned Production Time
Example Calculation
A good way to understand the OEE value better is to look at production examples and follow through with the calculations. Let’s assume the following inputs:
| Shift Length | 10 hours (600 minutes) |
| Scheduled Downtime | 36 minutes |
| Unexpected Downtime | 74 minutes |
| Ideal Cycle Time | 3.2 seconds |
| Total Count | 7,324 |
| Rejected Part Count | 314 |
Input Calculation:
Planned Production Time = Shift Length - Scheduled Downtime
Planned Production Time = 600 - 36 = 564
Run Time = Planned Production Time - Unexpected Downtime
Run Time = 564 - 74 = 490
Good Count = Total Count - Rejected Part Count
Good Count = 7,324 - 314 = 7,010
OEE Component Calculations:
Availability = Run Time / Planned Production Time
Availability = 490 / 564 = 86.9%
Performance = (Ideal Cycle Time * Total Count) / Run Time
Run Time in seconds = 490 * 60 = 29,400
Performance = (3.2 * 7,324) / (29,400) = 23,436.8 / 29,400 = 79.7%
Quality = Good Count / Total Count
Quality = 7,010 / 7,324 = 95.7%
OEE Calculation
86.9% * 79.7% * 95.7% = 66.3%
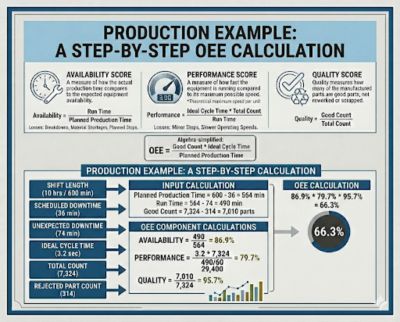
It is important to note that the OEE score is not an average, but instead the result of multiplying three values. So, a score of 90% in all three areas does not yield an OEE of 90%, but rather a value of 72.9%.
“Six Big Losses” and OEE Score Impact
Manufacturing and quality engineers take a deeper look at OEE scores by evaluating the root causes of low OEE values. Over time, the industry has categorized these sources into the following “Six Big Losses” across three traits.
- Availability losses: Situations that decrease the expected and actual availability.
- Unplanned stops: Usually due to equipment failures, material shortages, or infrastructure issues.
- Planned stops: Generated by equipment setup, adjustment, cleaning, warm-up time, and preventive maintenance.
- Performance losses: Situations that reduce the number of parts produced during the measured time.
- Small stops: Also called idling and minor stops, these are short-duration stops of less than five minutes.
- Slow cycles: Cycles that take longer than the ideal cycle are referred to as slow cycles and are caused by degraded lubrication, worn or dirty equipment, material issues, adverse environmental conditions, and sub-optimal operating parameters.
- Quality losses: Situations that increase the number of rejected parts
- Production rejects: Parts that are rejected during steady-state production (reworked and scrapped parts are both considered production rejects).
- Startup rejects: Because the root causes of rejection may differ during the startup phase of a shift, they are treated as a distinct type of loss.
Benchmark OEE Scores
Many companies use an OEE score as a key performance indicator (KPI), establishing a baseline value and then, through continuous improvement, working to improve the score over time. However, they also want to compare their OEE score with industry standard benchmarks. The common benchmarks used across industries are:
- 100% - Perfect: A perfect score indicates that production is perfect, with the system producing only good parts, at the ideal cycle time, with no stop time. In some cases, a perfect or near-perfect score means the ideal cycle time and planned production time can be improved.
- 85% - World Class: This is the goal most companies aim for, though it is rarely achieved. One study by a software company that provides OEE tracking found that globally, only 6% of manufacturing organizations reported a score of 85% or higher.
- 60% - Typical: A realistic and effective goal; a value around 60% is considered acceptable but indicates room for improvement in the production process.
- 40% - Low: A value at or below 40% is common for companies just starting their OEE data collection for the first time. It is the starting point for understanding equipment performance and where they need to make changes to improve manufacturing productivity.
Although these benchmarks are important, quality control and manufacturing engineers also look at the components that make up the score and how they improve over time. A good example is that many companies want to achieve a world-class OEE of 85%, including a 99.9% quality score.
Common Methods for Improving OEE Scores
Most teams begin their efforts to improve manufacturing productivity by implementing a robust data-gathering system, often including OEE software, to capture the data needed for the OEE score and other KPIs used in trusted platform modules (TPM) and lean manufacturing. Once they have information to guide them, they can make the following improvements:
- Evaluate each of the Six Big Losses and determine issues in each category to address.
- Deploy root cause analysis (RCA) to find underlying causes.
- Use data-driven decision-making across the organization.
- Apply automation where possible for maintenance, tool changing, inspection, and material handling.
- Deploy industry-standard best practices like lean manufacturing, continuous improvement, TPM, and six-sigma frameworks.
- Evaluate shifts and workers and design training and standard work to address production efficiency improvement opportunities around the human aspects of the processes.
Boosting Overall Equipment Effectiveness Through Simulation
All of the above methods for OEE improvement can benefit from the proper application of simulation at the component and system level. Engineers separate most applications into either physics-based modeling of machinery and manufacturing operations or system-level modeling of equipment or processes. Simulation is used because it:
- Avoids expensive real-world upgrades and experimentation that takes equipment offline.
- Enables fast iterations and “what-if” studies to understand the why behind productivity issues.
- Looks inside the system, providing data at locations where there are no sensors or no places to mount sensors.
- Provides data across use cases, not just historical situations.
- Delivers useful data to decision makers.
Engineers perform component-level simulation using physics-based tools that model the structural, thermal, chemical, fluid, or electromagnetic behavior of a piece of equipment, either optimizing it for increased production speed or reducing both planned and unplanned downtime. A good example of this is using a vibration simulation in a tool like Ansys Mechanical structural finite element analysis software to stiffen structural components to remove vibration at higher operating speeds. Or engineers use non-linear tools like Ansys LS-DYNA nonlinear dynamics structural simulation software to optimize speed and dwell time while reducing wear on the forming tool, thereby reducing manufacturing time and increasing the tool's useful life.
Simulation tools have improved at handling very complex situations, such as bulk material handling, which is common in many manufacturing processes. Ansys Rocky particle dynamics simulation software is a powerful example of using advanced discrete element modeling (DEM) to optimize the manufacturing of tablets and capsules in a drug production line, improving throughput, reducing unplanned downtime, and increasing the number of good parts.
On the system-level side of simulation, engineers deploy a wide array of system modeling tools, such as Ansys Partner Flownex for fluid-thermal systems, or the Ansys System Architecture Modeler platform to bring together different simulation disciplines and stakeholders to evaluate the manufacturing system as a whole.
Related Resources
Let’s Get Started
If you're facing engineering challenges, our team is here to assist. With a wealth of experience and a commitment to innovation, we invite you to reach out to us. Let's collaborate to turn your engineering obstacles into opportunities for growth and success. Contact us today to start the conversation.