-
-
Access Free Student Software
Ansys empowers the next generation of engineers
Students get free access to world-class simulation software.
-
Connect with Ansys Now!
Design your future
Connect with Ansys to explore how simulation can power your next breakthrough.
Free Trials
Products & Services
Learn
About
Back
Products & Services
Back
Learn
Ansys empowers the next generation of engineers
Students get free access to world-class simulation software.
Back
About
Design your future
Connect with Ansys to explore how simulation can power your next breakthrough.
Free Trials
ANSYS BLOG
March 20, 2023
Evaluating Synthetic Data: A Comparison with Real-World Data for Radar Applications
In our previous blog in this series, we learned what synthetic data is and its importance in training artificial intelligence/machine learning (AI/ML) systems for radar applications. To recap, synthetic data is information that is artificially generated rather than collected from real-world observations. It can be a valuable tool for training ML models with its ability to overcome data scarcity issues, simulate rare or hard-to-observe scenarios, and augment real-world data. However, there is a concern that synthetic data may not accurately represent real-world systems and phenomena. Coupled with that, radar systems are complex and require high-quality data.
To remedy these concerns, Ansys has developed a simulation workflow that enables you to model complex radar scenarios in real time using an electromagnetic (EM) simulation technique based on the shooting and bouncing rays (SBR) method. This solver is based on the same SBR solver found within Ansys HFSS and has been graphics processing unit (GPU)-accelerated to perform simulation in real time. This radar sensor simulation capability is available within Ansys AVxcelerate Sensors add-ons and provides the core toolset needed to generate high-quality synthetic data for radar applications. Still, to encourage widespread adoption of synthetic data, we need to build confidence in artificially generated data, validate it, and prove we can acquire it at scale with accuracy. Let’s take a closer look at how Ansys’ solution tackles these challenges.
Building Confidence: Validating Synthetic Data
There are several approaches that can be used to generate synthetic radar data for use in AI/ML applications. These approaches can be generally classified into three categories: reduced-order models (ROMs), data augmentation, and physics-based simulation.
ROMs involve using a simplified model to approximate the radar returns of complex scenes, while data augmentation includes modifying existing data to create a new, unique dataset by using AI/ML algorithms or other methods. Physics-based simulation requires using the fundamental laws of physics to describe wave propagation and interaction in a complex scene. However, if the synthetic data does not accurately represent the physical behavior of real-world systems, it will not be useful for real-world applications.
Ansys’ solution builds confidence in synthetic data by capturing the radar returns for a complex scene, including real material properties, animations, and antenna patterns. Therefore, Ansys’ solution delivers high accuracy, not approximations. Further, the resulting synthetic data can be created at scale, which is most useful and essential for effective ML training.
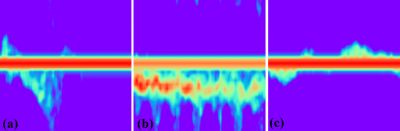
Example Doppler spectrograms for activities (a) falling, (b) walking, and (c) standing. Doppler frequency on the vertical axis and time on the horizontal axis.
This video illustrates pedestrian activity, including three behaviors: walking, falling, or standing idle.
To test the validity of the synthetic data, we conducted a study in which we implemented a real-world radar system as a digital twin and trained it using synthetic data. Next, we tested the results of this trained model on the real-world-equivalent radar system. Using radar returns in the form of Doppler spectrograms, we classified pedestrian activity into one of three categories: walking, falling, or standing idle.
Using a digital mission engineering approach, we simulated the virtual design of a system within a physics-based scenario model that incorporated all the elements of its operating environment. The virtual duplication of the real-world system consisted of a radar module, an environment, and a moving pedestrian.
By integrating the finite element method (FEM) solver in HFSS, we developed a virtual sensor and replicated the real-world environment (an open grass field) as a flat surface modeled with electrical material properties. Exact material properties are not critical for static objects within the Doppler spectrogram (as they have no velocity component), but we estimated material properties based on data defined in the IEEE Transactions on Antennas and Propagation paper, “Low grazing incidence millimeter-wave scattering models and measurements for various road surfaces.”1
To define the virtual pedestrian geometry, we used a poseable mannequin model that allowed us to position each joint in any orientation versus time to create realistic animations. Electrical material properties for the human model were assigned based on parametric models for the dielectric spectrum of tissues,2 and we defined activities as temporal animations of computer-aided design (CAD) geometry using a database of animations. By using a variety of animation sources, we assembled a curated library of 200 unique animations representing three activities, which provided a wide range of variability in the dataset.
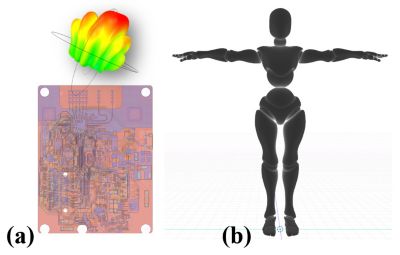
Digital twin components: (a) radar sensor and (b) poseable mannequin model.
Next, we simulated the environment and the pedestrian using the sensor simulation capability within AVxcelerate Sensors add-ons. This simulation environment enabled the definition of radiation characteristics based on our digital twin and consisted of fields generated by the transmission antenna and observed at the receiving antenna after scattering from the environment and pedestrian. In addition to the defined waveform, the simulation included materials, multipath propagation, transmission, reflection, and complex vector field components as observed by the radar sensor. Lastly, we simulated animated sequences containing the time variations of the geometry and captured Doppler spectrograms for the duration of the animation.
Acquiring Synthetic Data
Our radar digital twin formed the basis for the digital mission, which was to collect synthetic data for ML training. Scenarios were defined over a fixed length of time (four seconds). We then tested the resulting trained model on a real dataset to demonstrate the feasibility of using synthetic data to develop and physically deploy a radar perception system.
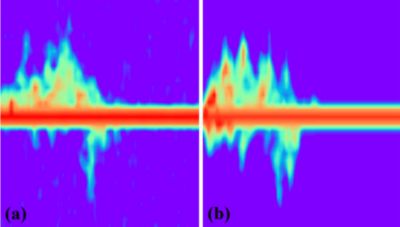
Doppler spectrogram for similar falling motions: (a) measured, (b) simulated.
Using the animation variations, we created a design of experiments (DOE) to offer a more varied solution set over all activities. The DOE included additional variation by altering the initial position, orientation, and geometry scaling. To create a sufficiently large dataset with a wide range of variation, we created 1,600 simulations of each activity using the radar sensor simulation capability within AVxcelerate Sensors to acquire and process the scattered fields into Doppler spectrograms. Simulations were completed at a rate of approximately 1,000 scenarios per hour on a single compute node. The performance and efficiency of this solver is a key component in generating synthetic data at scale without sacrificing accuracy.
Our radar module acquired real/measured data while volunteers acted out variations of different activities as radar returns were captured. The volunteers performed self-determined versions of the action with the initial position and orientation selected randomly within the radar’s field of view. This resulted in a wide variety of different falling motions, walking styles/speeds, and standing idle activities. In total, we captured 50 different variations of each activity. The resulting Doppler spectrograms were created using the same methods applied to the synthetic data, with the addition of a threshold to remove some of the low-level noise that is inherent in measured data.
Finally, we created a comparable virtual scenario using the recorded video of a specific fall activity measurement. These falls, when compared visually (animation video versus real video), contained the same initial position, orientation, and fall motion. The spectrograms displayed very similar features and showed visually that the synthetic data very closely represented the real data.
A Deeper Dive into Data
Through simulation, frequency, and digital mission engineering, we were able to prove the viability of using synthetic data for applications in radar perception based on ML algorithms. Additionally, we demonstrated the benefits of using digital mission engineering to generate high-quality synthetic data.
Stay tuned for our third blog in this series, in which we will explore more tools that enable synthetic data generation, including Ansys optiSLang and Ansys STK.
References
- E. S. Li and K. Sarabandi, “Low grazing incidence millimeter-wave scattering models and measurements for various road surfaces,” in IEEE Transactions on Antennas and Propagation, vol. 47, no. 5, pp. 851-861, May 1999.
- Gabriel, S; Lau, R W; Gabriel C, “The Dielectric Properties of biological tissues: III. Parametric models for the dielectric spectrum of tissues,” Phys. Med. Biol. 41 (1996), 2271-2293