Synopsys and Ansys power the future of innovation—connecting silicon to systems.
-
-
Access Free Student Software
Ansys empowers the next generation of engineers
Students get free access to world-class simulation software.
-
Connect with Ansys Now!
Design your future
Connect with Ansys to explore how simulation can power your next breakthrough.
Free Trials
Products & Services
Learn
About
Back
Products & Services
Back
Learn
Ansys empowers the next generation of engineers
Students get free access to world-class simulation software.
Back
About
Design your future
Connect with Ansys to explore how simulation can power your next breakthrough.
Free Trials
TOPIC DETAILS
What is A-Weighting?
A-weighting is a common type of frequency weighting method that is applied to any captured sound to make it correspond to a level that the human ear can hear. Sounds emitted have a wide range of frequencies, and the sound captured by a microphone is different from what is captured by the ear. Human ears can theoretically only hear between 20-20,000 Hz and are very sensitive to frequencies in the 250-5,000 Hz range, while being less sensitive to lower and higher frequencies.
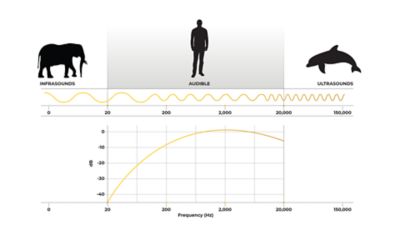
Human hearing range
So, by applying a specific weighting to each frequency within the sound, the level of the sound at that frequency will better reflect the actual perception of how loud it is. There are different types of weighting defined in the international standard IEC 61672:2003 depending on the loudness range of the sound and the intended application, but A-weighting is the most commonly used weighting approach. A-weighting is essentially a frequency filter across the frequency range that we can hear and allows sound level measurements in dB(A).
A-Weighting in Noise Measurement
Sound pressure level (SPL) is traditionally measured on a decibel (dB) scale. This is characterized by the amount of pressure exerted on the air by a sound wave. Sound measurement equipment will record and indicate a dB(SPL) value for all the frequencies. A-weighting reflects the relative impact of each frequency on human ear perception. From the moment the sound wave enters our ear to the final interpretation by our brain that it is a sound, the auditory system acts as a natural filter that leaves more space to some frequencies and less to others.
Example of a 1000 Hz sound
Example of a 100 Hz sound
Common Applications of A-Weighting
While there are many different types of frequency weighting systems, A-weighting has become the common standard for determining hearing damage and noise health effects, as well as for measuring many types of noise pollution (such as industrial or environmental noise).
Areas where A-weighted noise measurements are widely applied include:
- Electric motor and pump noise in the energy sector
- Noise, vibration, and harshness (NVH) in cars within the automotive and transportation industry
- Drones, aircraft, and helicopter noise in aerospace and defense sectors
- Production line noise levels
- Construction noise levels
- Internal noise levels within buildings
- Consumer product noises, including fans and different kitchen appliances (e.g. refrigerators)
- Environmental noise pollution for citizens and wildlife (e.g. close to airports and railways)
- Low-level noise in audio equipment
Differences Between dB and dB(A)
Compared to unweighted measurements in dB, dB(A) weighted measurements represent more of what you can actually hear. This means that two sounds can have the same dB level, but different dB(A) levels. For ensuring customer satisfaction during product development or systems design, the A-weighted value is used because it represents the best comfort for humans. The dB(A) scale is largely used in R&D departments for internal specifications and regulations across different industries. For example, in the European Union all vehicles need to obtain certification showing that the pass-by noise level does not exceed the sound levels for specific operating conditions and microphone positions (depending on the vehicle type). These measurement values for the certification are often represented in dB(A).
History of A-Weighting
A-weighting has been around for almost a century and goes back to fundamental research by Harvey Fletcher and Wilden Munson in 1933 on perspective loudness. The A-weighting curve was established fully in 1936 when the Fletcher-Munson’s equal-loudness contours (also known as equal-loudness curves) were published as an American National Standards Institute (ANSI) standard. Over time, these curves have been updated and released as the International Organization for Standardization (ISO) 226 standard, with the latest iteration being in 2003: ISO 226:2003. The IEC 61672:2003 now defines all the curves used in sound meters, which provide weighted frequency measurements from A-weighted to C-weighted (dB(C)) measurements.
The Fletcher-Munson equal loudness contours map how the human ear perceives loudness at different frequencies. It matches the ear sensitivity to various levels of a pure tone at the reference frequency of 1000 Hz. A-weighting is based on the inverted equal-loudness contour corresponding to 40 phons, that is, the perceived loudness of a 1000-Hz pure tone at 40 dB(SPL). This is equivalent to moderately quiet sounds. For example, a pure tone played at 1000 Hz at 40 dB(SPL) will be heard as loud as a pure tone of 50 dB(SPL) at 250 Hz or 8000 Hz as they have the same loudness level of 40 phons and, as this level is the basis contour for A-weighting, the same dB(A) level.
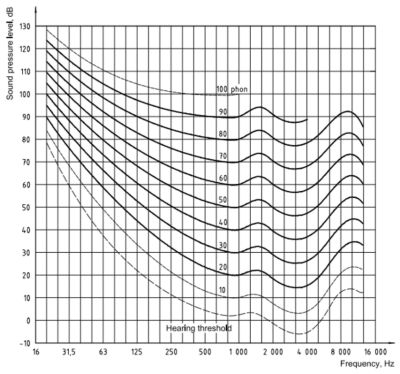
Example of equal loudness contours
A-weighting could more closely be matched to the inverted 40-phon equal-loudness curve if it fell steeply above 10 kHz, but for many years, steep filters were difficult to manufacture. There are now filters, such as the ITU-R 468 curve, that can emphasize frequencies from 1-9 kHz, but they are rarely integrated into most sound meters, and the standard A-weighting methods have remained unchanged for years.
Other Frequency-Weighting Curves
A-weighting has become the most used frequency weighting method and is used in many sound meters today. Outside of A-weighting, B-weighting is also used a lot, but other weightings ― C-weighting, D-weighting, G-weighting, and Z-weighting ― are less common. The choice of which weighting to use is based on the application and how loud the sound is. If it’s very low or very high, then a different weighting will be applied that better matches the sensitivity of the human ear.
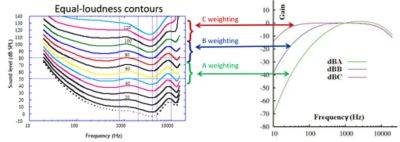
Graphical representation of equal loudness contours and different frequency weighting methods
Below is a general overview of how each frequency weighting method is used.
- A-weighting: Used for everyday moderate noise.
- B-weighting: Matches the 70-phon equal-loudness contour, which spans moderately loud sounds. It may be used for measuring the interior noise of vehicles, occupational noise, or public noise.
- C-weighting: Matches the 100-phon equal-loudness contour, which encompasses very loud sounds. Because of its flatter shape, C-weighting is mainly seen on sound level meters to measure broadband noise, but can also be used to measure the very loud noises from construction equipment.
- D-weighting: Used for specific applications such as measuring aircraft noise.
- G-weighting: Used for measurements in the infrasound range that can’t be heard by human ears, such as submarines, communications, and Wi-Fi.
- Z-weighting: Known as zero weighting because it is a flat frequency response with no filter.
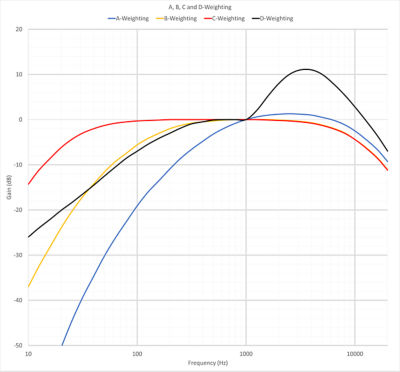
Graphical representation of the different weighting curves
A-Weighting in Simulation
Vibroacoustic simulation can be used to simulate the noise of the source at source level and on a system level to see how that sound will affect the comfort of humans. Most simulations are run in dB(SPL) and then filtered afterward to get the dB(A) value. Some examples of the sound that can be generated using simulation include:
- The movement of two parts or components moving close to each other, such as teeth in a gearbox, that will result in a sound being generated.
- The movement of other components that will generate sound.
- The impact sound from the crashing or dropping of an object.
- The movement of fluid through a pipe, a turbo, inside a fan, or inside a cavity.
- The sound of an electric motor.
- The vibration of different components and their pressure outputs.
- The propagation of sound pressures from the source to the ear or another receiver point.
All these sound sources can be simulated with Ansys tools, such as Ansys Mechanical, Ansys Motion, Ansys Fluent, and Ansys LS-DYNA software, and then analyzed in the Ansys Sound application, to look at how A-weighting can be applied to different industries. Using simulation helps to develop products within sound regulations and at sound levels that are not uncomfortable for the user or anyone in their vicinity.
If you’d like to find out more about how you can use simulation methods to design different components and products without noise that is not harmful to your customers, then get in touch with our technical team today.
Related Resources
Let’s Get Started
If you're facing engineering challenges, our team is here to assist. With a wealth of experience and a commitment to innovation, we invite you to reach out to us. Let's collaborate to turn your engineering obstacles into opportunities for growth and success. Contact us today to start the conversation.