Synopsys and Ansys power the future of innovation—connecting silicon to systems.
-
-
Access Free Student Software
Ansys empowers the next generation of engineers
Students get free access to world-class simulation software.
-
Connect with Ansys Now!
Design your future
Connect with Ansys to explore how simulation can power your next breakthrough.
Free Trials
Products & Services
Learn
About
Back
Products & Services
Back
Learn
Ansys empowers the next generation of engineers
Students get free access to world-class simulation software.
Back
About
Design your future
Connect with Ansys to explore how simulation can power your next breakthrough.
Free Trials
ANSYS BLOG
July 17, 2023
Stacking the Deck at the Tour de France?
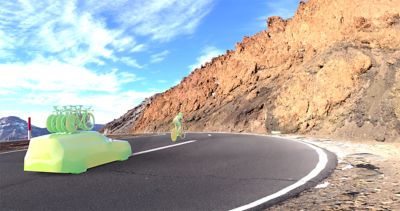
Figure 1: Rendering of a simulations showing a cyclist followed by a team car stacked with five bicycles.
We already know that a team car riding behind a cyclist gives the athlete an aerodynamic benefit. This physical insight was revealed in an earlier study by the same partners in 2015.1 The effect can be explained by the air mass that is pushed forward by the car body, as shown in the videos below. This generates a large overpressure bubble in front of the car (see red and yellow colors), which in turn exerts a significant push effect on the cyclist and allows him/her to ride faster with the same effort. In 2023, the International Cycling Union (UCI), after consulting with the researchers and others, changed the previous minimum distance between the cyclist and following team car from 10 m (32.8 feet) to 25 m (82 feet). However, a lack of proper measurement technology makes it difficult to actually enforce the minimum distance rules. Moreover, the 2015 study did not consider the potential benefit of bicycles stacked on the roof of the following car. To the best of our knowledge, no one has ever assessed in detail how much drag reduction is caused by different numbers and configurations of roof-top bicycles.
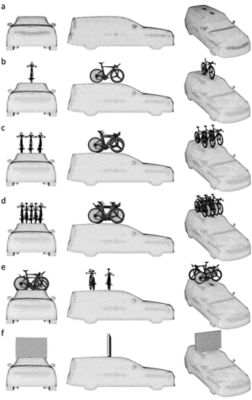
- A car without bikes on the roof (as in the previous study).
- A car with one, three, five, and 10 bikes on the roof, where those bicycles are oriented in the riding direction.
- A car with two perpendicularly placed bicycles with rear disk wheels to optimize the push effect.
- A car with a vertical plate on the roof representing the extreme case of an infinite number of bicycles squeezed onto the roof, or just a single bike placed perpendicular to the riding direction wrapped in a protection bag or hardcase.
The cyclist in the simulations assumes a time trial (TT) position on a TT bike that has a three-spoke front wheel and a rear disk wheel. Two cycling speeds are considered: a top time trial speed of 54 km/h (33.56 mph), which can be attained on a flat stage, and a much lower speed of 36 km/h (22.37 mph), which is an estimate of a top speed in the upcoming Tour de France time trial. The simulations were performed for calm weather conditions, so no crosswind, headwind, or tailwind is present.
Analyzing the Simulation Results
The results in terms of drag reduction and time gain for some different car configurations are summarized in Table 1a for a speed of 54 km/h and in Table 1b for 36 km/h. These values are compared to a cyclist riding alone, without a team car behind him/her. These numbers indicate that stacking bicycles on the roof slightly increases the aerodynamic benefit for the rider. However, the number gets substantially larger if and when teams adopt a specific configuration.
| d = 1 m | d = 5 m | d = 10 m | d = 25 m | ||||
| DR (%) | Time (s) per km | DR (%) | Time (s) per km | DR (%) | Time (s) per km | DR (%) | Time (s) per km |
Car without bike | 13.74 | 3.34 | 1.39 | 0.32 | 0.39 | 0.09 | 0.14 | 0.03 |
Car with 5 bikes | 16.5 | 4.04 | 1.53 | 0.36 | 0.49 | 0.11 | 0.22 | 0.05 |
Car with 10 bikes | - | - | 1.73 | 0.40 | 0.55 | 0.13 | 0.24 | 0.06 |
Car with 2 bikes perpendicular | 17.1 | 4.21 | 2.30 | 0.54 | 0.91 | 0.21 | 0.51 | 0.12 |
Car with vertical plate | 18.3 | 4.52 | 3.30 | 0.77 | 1.40 | 0.33 | 0.80 | 0.19 |
Table 1a. Drag reductions (DR in %) and time gains (s) for different car configurations at separation distances d = 1, 5, 10, 25 m; compared to a cyclist without a following car riding at 54 km/h.
| d = 1 m | d = 5 m | d = 10 m | d = 25 m | ||||
| DR (%) | Time (s) per km | DR (%) | Time (s) per km | DR (%) | Time (s) per km | DR (%) | Time (s) per km |
Car without bike | 13.74 | 4.58 | 1.39 | 0.44 | 0.39 | 0.12 | 0.14 | 0.05 |
Car with 5 bikes | 16.49 | 5.55 | 1.53 | 0.49 | 0.49 | 0.16 | 0.22 | 0.07 |
Car with 10 bikes | - | - | 1.73 | 0.55 | 0.55 | 0.18 | 0.24 | 0.08 |
Car with 2 bikes perpendicular | 17.10 | 5.77 | 2.30 | 0.74 | 0.91 | 0.29 | 0.51 | 0.16 |
Car with vertical plate | 18.26 | 6.20 | 3.30 | 1.06 | 1.40 | 0.45 | 0.80 | 0.26 |
Table 1b: Drag reductions (DR in %) and time gains (s) for different car configurations at separation distances d = 1, 5, 10, 25 m; compared to a cyclist without a following car riding at 36 km/h.
“Time trial bikes are designed to be aerodynamic. So putting a few on the roof of a car, oriented in their riding direction, does not give a huge advantage,” says Professor Blocken. “However, the advantage increases strongly when bikes with rear disk wheels are placed on the roof perpendicular to the riding direction. We hope that this study can lead to new regulations that will avoid this type of unfair advantages.”
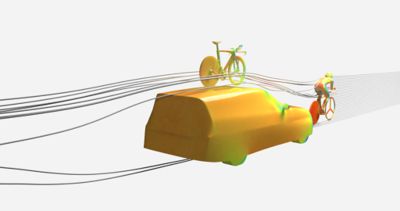
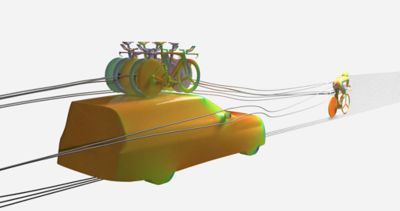
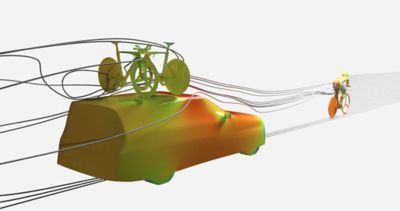
Figure 3. From left to right: Simulations showing one bike on a car roof following at 1 m, five bikes on a car following at 5 m, and two bikes arranged perpendicularly on a car following at 5 m.
Having just one bike on the roof is a realistic situation. It could also be a future regulatory maximum number, as one spare bike should be sufficient in almost every circumstance. For a car with five bikes on the roof and a separation distance of 10 m, the relative time gain over 22.4 km would be 0.57 second. A car with 10 bikes on the roof would give a gain of 1 second. Stacking two bikes placed perpendicular to the riding direction yields a gain of 3.57 seconds. Stacking just one bike in a plastic protective cover on the roof yields a gain of 7.08 seconds. For a 5 m separation distance in this 22.4 km time trial, the relative gain would be 0.86 second for the car with five bikes, 2.30 seconds for the car with 10 bikes, 6.41 seconds for the car with two bikes perpendicular to the riding direction, and 13.66 seconds for the car with a single perpendicularly placed bike in a large plastic protective cover or hardcase.
It remains to be seen whether we will see teams exploiting the push effect by stacking many bikes on the roof, or adopting the idea of stacking two bikes with disk wheels perpendicular to the riding direction on the roof. Time gains per kilometer and for the whole 22.4 km time trial, compared to a cyclist followed by a car with only one bike on the roof and riding at 36 km/h, which is an estimate of the average speed for this time trial, are given in Table 2.
| Time gain (s) compared to car with 1 bike per km at 36 km/h | Time gain (s) compared to car with 1 bike per km at 36 km/h | ||||||
| 1 m | 5 m | 10 m | 25 m | 1 m | 5 m | 10 m | 25 m |
Car 3 bikes | 0.420 | 0.019 | 0.013 | 0.010 | 9.402 | 0.432 | 0.285 | 0.214 |
Car 5 bikes | 0.843 | 0.038 | 0.025 | 0.022 | 18.892 | 0.862 | 0.571 | 0.498 |
Car 10 bikes | 2.102 | 0.103 | 0.045 | 0.029 | 47.082 | 2.300 | 0.999 | 0.641 |
Car 2 bikes perpendicular | 1.062 | 0.286 | 0.159 | 0.115 | 23.790 | 6.409 | 3.572 | 2.566 |
Car with plate | 1.495 | 0.610 | 0.316 | 0.207 | 33.497 | 13.657 | 7.084 | 4.638 |
Table 2: Time gains (s) for different car configurations at separation distances d = 1, 5, 10, 25 m, compared to a car with 1 bike on the roof at 36 km/h.
Simulation Can Help Ensure Fair Racing
Because time trials are sometimes decided by seconds, or even tenths or hundredths of a second, the number of bicycles on the roof of a team car and the way they are oriented could very well decide who wins this time trial. Note that in the 2022 UCI World Championships in Wollongong, Australia, the difference between the gold and the silver medal was only 2.95 seconds, and the difference between gold and bronze only 9.16 seconds. A team car optimally stacked with roof-top bicycle(s) and riding close enough behind the cyclist can yield aerodynamic benefits that could be large enough to decide who wins and who loses time trials.
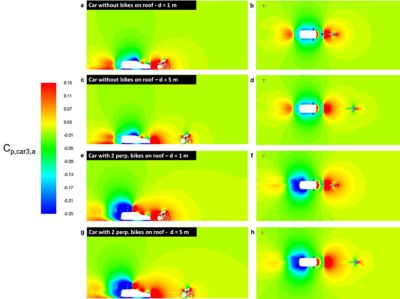
Figure 4. Contours of the static pressure in a vertical centerplane and a horizontal plane at a 1 m (3.3 feet) height, for the configuration of the car without bikes on the roof and the car with two perpendicularly placed bikes on the roof, and for separation distances between cyclist and car d = 1 and 5 m. Red is overpressure, blue is suction. The car generates a large overpressure bubble in front of it, which provides a “push” to the cyclist, who can then, with power remaining constant, cycle faster. It is clear that the car with the 2 bikes on the roof provides a much larger overpressure bubble in front of the car (red and yellow colors) and therefore exerts a larger push effect on the cyclist.