Synopsys and Ansys power the future of innovation—connecting silicon to systems.
-
-
Kostenlose Software für Studierende
Ansys unterstützt die nächste Generation von Ingenieur*innen
Studenten erhalten kostenlosen Zugang zu erstklassiger Simulationssoftware.
-
Verbinden Sie sich jetzt mit Ansys!
Gestalten Sie Ihre Zukunft
Stellen Sie eine Verbindung mit Ansys her, um zu erfahren, wie Simulation Ihren nächsten Durchbruch vorantreiben kann.
Kostenlose Demoversionen
Produkte & Dienstleistungen
Lernportal
Über das Unternehmen
Back
Produkte & Dienstleistungen
Back
Lernportal
Ansys unterstützt die nächste Generation von Ingenieur*innen
Studenten erhalten kostenlosen Zugang zu erstklassiger Simulationssoftware.
Back
Über das Unternehmen
Gestalten Sie Ihre Zukunft
Stellen Sie eine Verbindung mit Ansys her, um zu erfahren, wie Simulation Ihren nächsten Durchbruch vorantreiben kann.
Kostenlose Demoversionen
THEMENDETAILS
Was versteht man unter Gesamtanlageneffektivität?
Die Gesamtanlageneffektivität ist eine Leistungskennzahl in der Fertigung, die die Leistung eines Prozesses oder einer Anlage angibt. Anstatt sich ausschließlich auf Ausfallzeiten zu konzentrieren, zeigt der OEE-Wert den Ingenieur*innen und dem Management die kombinierte Verfügbarkeit, Leistung und Qualität eines Fertigungsprozesses oder einer Maschine. Ein perfekter OEE-Wert von 100 % bedeutet, dass das evaluierte System so schnell wie möglich einwandfreie Teile produziert, ohne dass es zu Stillstandszeiten kommt.
Die OEE wurde in den 1960er Jahren von Seiichi Nakajima als Teil des „Total Productive Maintenance“-Konzepts (TPM) entwickelt und hat sich zu einem Instrument weiterentwickelt, mit dem Probleme identifiziert werden und anschließend die Wirksamkeit der Lösungen beobachtet wird. Ursprünglich wurde die OEE monatlich oder vierteljährlich von den Produktionsleiter*innen berechnet; heute kann sie dank Echtzeitüberwachung durch das industrielle Internet der Dinge (iIoT) sofort ermittelt werden.
Zu den häufigsten Vorteilen der Einbindung der OEE in die Qualitätsmanagementprozesse eines Werks zählen unter anderem:
- Gesteigerte Effizienz: Die OEE ist ein nützliches Instrument zur Erkennung von Ineffizienzen und dient gleichzeitig als sinnvolles Maximierungsziel für Optimierungsmaßnahmen.
- Kostensenkung: Die Minimierung von Ausfallzeiten, Nacharbeit und Ausschuss senkt die Ausgaben.
- Produktivitätssteigerung: Höhere OEE-Werte deuten auf eine verbesserte Qualität, Verfügbarkeit und Produktion hin – allesamt Kennzahlen für die Produktivität.
- Informierte Entscheidungsfindung: Die in den OEE-Wert einfließenden Faktoren sowie der Wert selbst liefern Ingenieur*innen, Planer*innen und Manager*innen umsetzbare Erkenntnisse.
- Verbesserte Lebensdauer und Zuverlässigkeit der Anlage: Da die Betriebszeit ein wesentlicher Bestandteil der Gesamtanlageneffektivität ist, motiviert sie das Personal dazu, die Lebensdauer und Zuverlässigkeit der Anlagen durch proaktive Wartungsmaßnahmen zu verbessern.
So wird die Gesamtanlageneffektivität berechnet
Der OEE-Wert für eine Anlage wird berechnet, indem die ermittelten Werte für Verfügbarkeit, Leistung und Qualität miteinander multipliziert werden. Die OEE-Formel ist nachfolgend definiert.
OEE = Verfügbarkeit × Leistung × Qualität
Dabei werden die Komponenten der OEE wie folgt definiert.
Verfügbarkeitswert
Die Verfügbarkeit ist ein Maß dafür, inwieweit die tatsächliche Produktionszeit der erwarteten Anlagenverfügbarkeit entspricht. Zu den Verfügbarkeitsverlusten zählen Anlagenausfälle, Materialengpässe und geplante Stillstände.
Verfügbarkeit = Betriebszeit ÷ geplante Produktionszeit
Leistungswert
Die Leistung ist ein Maß dafür, wie schnell die Anlage im Vergleich zu ihrer maximal möglichen Geschwindigkeit oder der idealen Zykluszeit läuft. Die ideale Zykluszeit ist die Zeit, die benötigt wird, um ein Teil ohne Verlangsamungen oder kleinere Unterbrechungen herzustellen. Ein niedriger Leistungswert kann durch langsamere Betriebsgeschwindigkeiten aufgrund von Maschineneinstellungen, Materialproblemen, verschlissenen Werkzeugen oder unaufmerksamen Bediener*innen verursacht werden. Kleinere Unterbrechungen durch Sensorauslösungen, Zuführungsfehler oder Staus können den Leistungswert ebenfalls senken. Die Gesamtanzahl ist die Anzahl der während des Messzeitraums hergestellten Teile.
Leistung = (ideale Zykluszeit × Gesamtanzahl) ÷ Betriebszeit
Qualitätswert
Die Qualität gibt an, wie viele der hergestellten Teile mängelfrei sind (Gutteile) und keine zusätzliche Nacharbeit erfordern oder aussortiert werden müssen.
Qualität = Anzahl Gutteile ÷ Gesamtanzahl
Mit einer kleinen Gleichung lässt sich die OEE-Berechnung wie folgt umstellen:
OEE = (Anzahl Gutteile × ideale Zykluszeit) ÷ geplante Produktionszeit
Berechnungsbeispiel
Der OEE-Wert ist besser verständlich, wenn Sie sich Produktionsbeispiele ansehen und die Berechnungen nachvollziehen. Nehmen wir folgende Eingangswerte an:
| Schichtdauer | 10 Stunden (600 Minuten) |
| Geplante Ausfallzeit | 36 Minuten |
| Ungeplante Ausfallzeit | 74 Minuten |
| Ideale Zykluszeit | 3,2 Sekunden |
| Gesamtanzahl | 7.324 |
| Anzahl Ausschussteile | 314 |
Berechnung der Eingabewerte:
Geplante Produktionszeit = Schichtdauer – geplante Ausfallzeit
Geplante Produktionszeit = 600 – 36 = 564
Betriebszeit = geplante Produktionszeit – ungeplante Ausfallzeit
Betriebszeit = 564 – 74 = 490
Anzahl Gutteile = Gesamtanzahl – Anzahl Ausschussteile
Anzahl Gutteile = 7.324 – 314 = 7.010
Berechnung der OEE-Komponenten:
Verfügbarkeit = Betriebszeit ÷ geplante Produktionszeit
Verfügbarkeit = 490 ÷ 564 = 86,9 %
Leistung = (ideale Zykluszeit × Gesamtanzahl) ÷ Betriebszeit
Betriebszeit in Sekunden = 490 × 60 = 29.400
Leistung = (3,2 × 7.324) ÷ (29.400) = 23.436,8 ÷ 29.400 = 79,7 %
Qualität = Anzahl Gutteile ÷ Gesamtanzahl
Qualität = 7.010 ÷ 7.324 = 95,7 %
Berechnung der OEE
86,9 % × 79,7 % × 95,7 % = 66,3 %
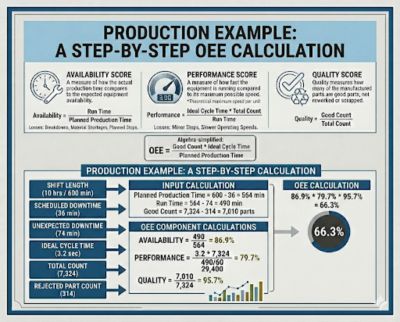
Wichtig: Der OEE-Wert ist kein Durchschnittswert, sondern das Ergebnis der Multiplikation dreier Werte. Ein Wert von 90 % in allen drei Bereichen ergibt also keine OEE von 90 %, sondern einen Wert von 72,9 %.
„Sechs große Verluste“ und ihre Auswirkungen auf den OEE-Wert
Fertigungs- und Qualitätsingenieur*innen analysieren OEE-Werte eingehender, indem sie die Ursachen für niedrige OEE-Werte ermitteln. Im Laufe der Zeit hat die Branche diese Ursachen anhand von drei Merkmalen in die folgenden „Sechs großen Verluste“ unterteilt.
- Verfügbarkeitsverluste: Situationen, die die erwartete und tatsächliche Verfügbarkeit verringern.
- Ungeplante Stillstände: Meist verursacht durch Anlagenausfälle, Materialengpässe oder Infrastrukturprobleme.
- Geplante Stillstände: Verursacht durch Einrichtarbeiten, Justage, Reinigung, Aufwärmzeiten und vorbeugende Wartung der Anlagen.
- Leistungsverluste: Situationen, die die Anzahl der während der Messzeit produzierten Teile verringern.
- Kurzzeitstillstände: Auch Leerlaufzeiten genannt. Kurze Stillstände von weniger als fünf Minuten.
- Langsamzyklen: Zyklen, die länger dauern als der ideale Zyklus und auf Schmiermängel, verschlissene/verschmutzte Anlagen, Materialprobleme, ungünstige Umgebungsbedingungen oder suboptimale Betriebsparameter zurückzuführen sind.
- Qualitätsverluste: Situationen, die die Anzahl der Ausschussteile erhöhen
- Produktionsausschuss: Teile, die während der regulären Produktion aussortiert werden (sowohl nachbearbeitete als auch verschrottete Teile gelten als Produktionsausschuss).
- Anlaufausschuss: Da die Ursachen für Ausschuss während der Anlaufphase einer Schicht unterschiedlich sein können, werden sie als eigenständige Verlustart behandelt.
Benchmark- OEE- Werte
Viele Unternehmen nutzen den OEE-Wert als Leistungskennzahl (KPI), legen eine Baseline fest und arbeiten dann durch kontinuierliche Verbesserung daran, diesen Wert im Laufe der Zeit zu steigern. Allerdings möchten sie ihren OEE-Wert auch mit branchenüblichen Benchmarks vergleichen. Die branchenübergreifend üblichen Benchmarks sind:
- 100 % (perfekt):: Ein perfekter Wert bedeutet, dass die Produktion fehlerfrei verläuft: Das System produziert ausschließlich einwandfreie Teile in der idealen Zykluszeit und ohne Stillstandszeiten. In manchen Fällen deutet ein (nahezu) perfekter Wert darauf hin, dass die ideale Zykluszeit und die geplante Produktionszeit noch verbessert werden können.
- 85 % (Weltklasse): Ein Wert, den die meisten Unternehmen anstreben, der jedoch nur selten erreicht wird. Eine Studie eines Softwareunternehmens, das OEE-Tracking anbietet, ergab, dass weltweit nur 6 % der produzierenden Unternehmen einen Wert von 85 % oder höher erreichen.
- 60 % (Durchschnitt): Ein realistisches und effektives Ziel; ein Wert um 60 % gilt als akzeptabel, deutet jedoch auf Verbesserungspotenzial im Produktionsprozess hin.
- 40 % (Unterdurchschnitt): Ein Wert von 40 % oder darunter ist üblich für Unternehmen, die gerade erst mit der Erfassung ihrer OEE-Daten beginnen. Er dient als Ausgangspunkt, um die Leistung der Anlagen zu verstehen und zu erkennen, wo Änderungen erforderlich sind, um die Produktivität in der Fertigung zu steigern.
Auch wenn diese Benchmarks wichtig sind, betrachten Qualitätskontroll- und Fertigungstechniker*innen auch die einzelnen Komponenten, aus denen sich der Wert zusammensetzt, und wie sie sich im Laufe der Zeit verbessern. Ein gutes Beispiel hierfür ist, dass viele Unternehmen eine OEE von Weltklasse in Höhe von 85 % anstreben – bei einem Qualitätswert von 99,9 %.
Methoden zur Verbesserung der OEE
Die meisten Teams beginnen ihre Bemühungen zur Steigerung der Fertigungsproduktivität mit der Einführung eines robusten Datenerfassungssystems (häufig mit OEE-Software), um die für den OEE-Wert und andere KPIs erforderlichen Daten zu erfassen, die dann in Trusted Platform Modules (TPM) und im Lean Manufacturing verwendet werden. Sobald Informationen vorliegen, an denen sie sich orientieren können, können sie folgende Verbesserungen vornehmen:
- Bewertung aller sechs Verlustursachen und Bestimmung der Probleme in jeder Kategorie.
- Durchführung der Ursachenanalyse (RCA), um die zugrunde liegenden Ursachen zu ermitteln.
- Unternehmensweite Nutzung datengestützter Entscheidungsfindung.
- Nach Möglichkeit Automatisierung von Wartungsarbeiten, Werkzeugwechseln, Inspektionen und Materialbeförderung.
- Nutzung branchenüblicher Best Practices wie Lean Manufacturing, kontinuierliche Verbesserung, TPM und Six Sigma.
- Bewertung von Schichten und Personal sowie Entwicklung von Schulungen und Standardarbeitsanweisungen, um Möglichkeiten zur Verbesserung der Produktionseffizienz im Zusammenhang mit den menschlichen Aspekten der Prozesse zu nutzen.
Steigerung der Gesamtanlageneffektivität durch Simulation
Alle oben genannten Methoden zur Verbesserung der OEE können von der richtigen Anwendung von Simulationen auf Komponenten- und Systemebene profitieren. Ingenieur*innen unterteilen die meisten Anwendungen entweder in die physikalische Modellierung von Maschinen und Fertigungsprozessen oder in die systemische Modellierung von Anlagen oder Prozessen. Simulationen werden eingesetzt, weil sie:
- teure Upgrades und Experimente in der Praxis vermeiden, die zu einer Stilllegung der Anlagen führen;
- schnelle Iterationen und „Was-wäre-wenn“-Analysen ermöglichen, um die Ursachen von Produktivitätsproblemen zu verstehen;
- Einblicke in das System geben und Daten dort liefern, wo keine Sensoren vorhanden sind oder keine Möglichkeit zur Anbringung von Sensoren besteht;
- Daten über verschiedene Anwendungsfälle hinweg liefern, nicht nur für vergangene Situationen;
- Entscheidungsträgern nützliche Daten liefern.
Ingenieur*innen führen Simulationen auf Komponentenebene mit auf Physik basierenden Tools durch, die das strukturelle, thermische, chemische, strömungstechnische oder elektromagnetische Verhalten einer Anlage modellieren, um diese entweder für eine höhere Produktionsgeschwindigkeit zu optimieren oder sowohl geplante als auch ungeplante Ausfallzeiten zu reduzieren. Ein gutes Beispiel ist der Einsatz einer Schwingungssimulation mit der Software Ansys Mechanical für die strukturelle Finite-Elemente-Analyse, um tragende Komponenten zu versteifen und so Schwingungen bei höheren Betriebsgeschwindigkeiten zu beseitigen. Des Weiteren nutzen Ingenieur*innen nichtlineare Tools wie die nichtlineare Dynamik-Simulationssoftware Ansys LS-DYNA, um Geschwindigkeit und Verweilzeit zu optimieren und gleichzeitig den Verschleiß des Umformwerkzeugs zu verringern, wodurch die Fertigungszeit verkürzt und die Lebensdauer des Werkzeugs verlängert wird.
Simulationstools sind mittlerweile besser in der Lage, hochkomplexe Situationen zu bewältigen, beispielsweise den Umgang mit Schüttgut, der in vielen Fertigungsprozessen üblich ist. Die Partikeldynamik-Simulationssoftware Ansys Rocky ist ein eindrucksvolles Beispiel für den Einsatz fortschrittlicher Modellierung von diskreten Elementen (DEM) zur Optimierung der Herstellung von Tabletten und Kapseln in einer Arzneimittelproduktionslinie, um den Durchsatz zu verbessern, ungeplante Ausfallzeiten zu reduzieren und die Anzahl der Gutteile zu erhöhen.
Auf der Systemebene der Simulation setzen Ingenieur*innen eine breite Palette von Systemmodellierungswerkzeugen ein, beispielsweise Ansys Partner Flownex für thermofluidische Systeme oder die Plattform Ansys System Architecture Modeler, um verschiedene Simulationsdisziplinen und Stakeholder zusammenzuführen und das Fertigungssystem als Ganzes zu bewerten.
Zugehörige Ressourcen
Los geht's
Wenn Sie mit technischen Herausforderungen konfrontiert sind, ist unser Team für Sie da. Mit unserer langjährigen Erfahrung und unserem Engagement für Innovation laden wir Sie ein, sich an uns zu wenden. Lassen Sie uns zusammenarbeiten, um Ihre technischen Hindernisse in Chancen für Wachstum und Erfolg zu verwandeln. Kontaktieren Sie uns noch heute, um das Gespräch zu beginnen.