-
-
Access Free Student Software
Ansys empowers the next generation of engineers
Students get free access to world-class simulation software.
-
Connect with Ansys Now!
Design your future
Connect with Ansys to explore how simulation can power your next breakthrough.
Free Trials
Products & Services
Learn
About
Back
Products & Services
Back
Learn
Ansys empowers the next generation of engineers
Students get free access to world-class simulation software.
Back
About
Design your future
Connect with Ansys to explore how simulation can power your next breakthrough.
Free Trials
ANSYS BLOG
April 13, 2021
Building Better Batteries: Characterize Battery Parameters for Simulation
The global economy is rapidly transitioning to portable and storable electricity, which impacts every major technology sector, especially consumer electronics, clean energy and mobility/transportation. The electric vehicle (EV) market, in particular, has seen a significant uptick in sales in the past decade. According to BloombergNEF, by 2040 over half of all passenger vehicle sales will be electric. Of course, this will also directly impact battery sales, making battery reliability and lifetimes will more important as we transition away from gas-powered vehicles.

According to BloombergNEF, by 2040 over half of all passenger vehicle sales will be electric.
To test for battery reliability, battery parameters must be identified. The commonly used model for such applications is the battery equivalent circuit model (ECM), which is an electrical representation of the charging and discharging characteristics using a set of resistors and capacitors with a voltage source and current. The ECM parameter identification requires test data that covers the dynamic range of the battery operating conditions. Replicating these use environments and capturing the dynamic behavior of the battery in test is key to accurately modeling the performance of the battery.
Hybrid pulse power characterization (HPPC) testing can be applied to determine the dynamic performance over the usable voltage ranges of the cell — resulting in accurate battery parameter identification to create robust battery models for simulation.
Watch the webinar to learn more: HPPC Testing for ECM Modeling and Battery Reliability
What is HPPC Testing?
HPPC testing is a methodology used to determine the dynamic performance characteristics of a battery. This testing determines battery power capability over the cell’s usable voltage range. It is a test profile that incorporates both discharge and regeneration pulses that take place at various states of charge (SOC), and which can be performed under various temperature stressors and current loads. A discharge pulse is a relatively short load drawn on the battery, and a regeneration pulse is a relatively short charge to the battery. This profile mimics the discharge and charge that can occur on hybrid EVs during acceleration and regenerative breaking.
The test profile itself comprises two sections:
- Static capacity test
- HPPC test
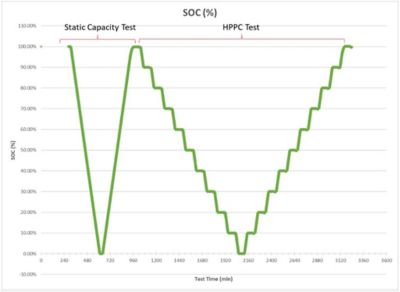
Figure 1: Test profile comprised of static capacity and HPPC tests
Static Capacity Test
The static capacity test starts by taking a battery from an unknown SOC to 100% SOC per the manufacturer's charging instructions. This is typically done at a set C-rate, representing the rate of current supplied (charge) or current drawn (discharge) relative to its maximum capacity. The C-rate is defined as the current in use divided by the theoretical current under which the battery would deliver its nominal rated capacity in one hour. For example, if a cell has a nominal rated capacity of 2000 mA-hr, and a C-rate of 1.5 was used to discharge the battery, the current in use would be 3 A.
The battery is charged at a constant current until the charge voltage is reached (the voltage at full capacity), and then is switched over to constant voltage charging until a minimum current is reached. This is known as a constant-current, constant-voltage (CCCV) charge scheme. The battery has reached 100% SOC, and a sufficient rest period is used to allow the cell to come to equilibrium.
Next, the battery is discharged at a prescribed C-rate to a minimum voltage cutoff. This is reached at 0% SOC. The discharge capacity can be measured directly via a dedicated battery tester, or determined from the current drawn in the time period from 100% SOC to 0% SOC. Another rest period is employed before recharging back to 100% SOC using the CCCV scheme.
The discharge capacity from 100% to 0% SOC is taken as the battery capacity. Typically, you should find it is consistent with the charge capacity measured. The discharge capacity is generally used for consistency, especially if only performing the first half (discharge) of the next section of the test profile – the HPPC test.
HPPC Test
For the HPPC test, 10% SOC steps are used based on the battery capacity determined from the static capacity test above. The steps are made from 100% to 0% SOC, and can continue back to 100% SOC for the second half of the test profile.
Each step consists of:
- Rest for 60 minutes.
- Pulse, discharge: 1C for 10 seconds
- Rest for 10 minutes (relaxation period)
- Pulse, regeneration: 1C or 0.75C for 10 seconds
- Rest for 10 minutes (relaxation period)
- Discharge/charge to next step at prescribed discharge/charge C-rate (per manufacturer’s data sheet)
Each cell type can be tested at each SOC, including across various temperatures and various C-rates for the pulses (discharge and charge).
Post-Processing for ECM
Once the HPPC testing data is collected, post-processing begins with analysis of the voltage and current response versus time. Each voltage-time curve generated can be used to extract six parameters for use in the battery equivalent circuit model (ECM):
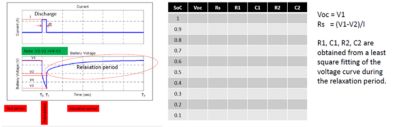
Figure 2: HPPC parameters recorded and determined
- Voc: Open circuit voltage at SOC
- Rs: Instantaneous series resistance of battery based on immediate voltage drop as discharge begins at time To of pulse
- R1, C1, R2, C2: Resistance and capacitance based on a least square fitting of the voltage curve during the relaxation period
A battery ECM is shown below. It is made up of a set or resistors and capacitors with a voltage source and current shown. The voltage measured (VM1) is the voltage response predicted over time during the relaxation period.
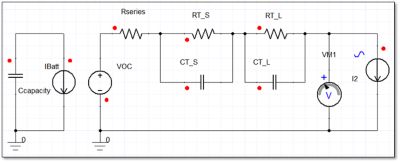
Figure 3: Battery ECM schematic
The plot below shows an example of HPPC data at one SOC and one temperature. The most complete set of HPPC data contains a curve at each SOC, various temperatures, various C-rates, and following both discharge and charge pulses. Such a complete set would have a few hundred of these curves across several samples. A battery ECM will need such data to accurately reflect the cell’s performance under a variety of conditions.
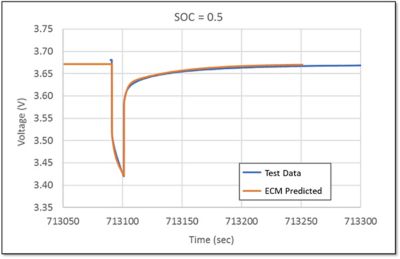
Figure 4: Test data and predicted values from discharge pulse at 50% SOC
The mathematical representation of the ECM model, with the correct parameters derived from the HPPC testing, can be used to simulate and predict the performance of the battery under various environmental and load conditions. The output of the ECM predicted values (orange line above) is shown relative to the test data (blue line above). In this case, the ECM very closely predicts the actual test data.
HPPC testing enables you to accurately parameterize the battery model for a specific cell. This model can then be used to simulate dynamic battery performance under various environmental usage conditions. This capability will become increasingly important as the EV market share continues to grow.
Ansys now has the capability to perform these battery characterization tests and create models for simulation. Learn more about our Battery Reliability services or request a quote.