-
United States -
United Kingdom -
India -
France -
Deutschland -
Italia -
日本 -
대한민국 -
中国 -
台灣
-
Ansys is committed to setting today's students up for success, by providing free simulation engineering software to students.
-
Ansys is committed to setting today's students up for success, by providing free simulation engineering software to students.
-
Ansys is committed to setting today's students up for success, by providing free simulation engineering software to students.
-
Contact Us -
Careers -
Students and Academic -
For United States and Canada
+1 844.462.6797
TECPLOT.COM
Tecplot specializes in visual data analysis tools that boost your productivity, integrate into your workflows and cut time in understanding CFD, simulation or experimental results. Fast, reliable, easy-to-use and memory efficient, Tecplot software helps you understand and communicate your results to others. For over 35 years, and with thousands of aerospace customers worldwide, Tecplot has become the trusted name in visual data analysis and CFD post-processing.
With Tecplot 360, you are able to:
- Explore large data sets composed of multiple solutions or experiments with Chorus.
- Speed automation and link workflows together with a Python API, PyTecplot.
- Access remote data with a lightweight client-server model, SZL Server.
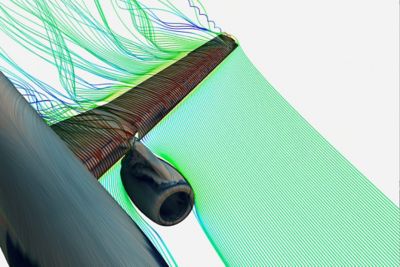
- Transform your data into stunning 2D and 3D plots, images and animations.
- Create and combine multiple sets of XY, contour, vector, surface and scatter plots.
- Customize your plots exactly the way you want for technical papers, reports, proposals and Web sites.
- Analyze your data visually with a context-sensitive, interactive user interface.
- Discover and understand anomalies and hidden phenomena in complex data.
- Most software is available on Windows/Mac/Linux platforms.
Tecplot offers Ansys FLUENT users an alternative to its built-in graphics capabilities such as easy positioning of multiple overlapping/overlaying plots on the same page, creating multiple axes, overlaying multiple families of contour lines, data transformation capabilities for reducing your data to presentation form, and exceptionally high-quality PostScript and WMF output formats.
Let’s Get Started
If you're facing engineering challenges, our team is here to assist. With a wealth of experience and a commitment to innovation, we invite you to reach out to us. Let's collaborate to turn your engineering obstacles into opportunities for growth and success. Contact us today to start the conversation.


