-
-
Software gratuito per studenti
Ansys potenzia la nuova generazione di ingegneri
Gli studenti hanno accesso gratuito a software di simulazione di livello mondiale.
-
Connettiti subito con Ansys!
Progetta il tuo futuro
Connettiti a Ansys per scoprire come la simulazione può potenziare la tua prossima innovazione.
Paesi e regioni
Customer Center
Supporto
Partner Community
Contatta l'ufficio vendite
Per Stati Uniti e Canada
Accedi
Prove Gratuite
Prodotti & Servizi
Scopri
Chi Siamo
Back
Prodotti & Servizi
Back
Scopri
Ansys potenzia la nuova generazione di ingegneri
Gli studenti hanno accesso gratuito a software di simulazione di livello mondiale.
Back
Chi Siamo
Progetta il tuo futuro
Connettiti a Ansys per scoprire come la simulazione può potenziare la tua prossima innovazione.
Customer Center
Supporto
Partner Community
Contatta l'ufficio vendite
Per Stati Uniti e Canada
Accedi
Prove Gratuite
DETTAGLI SULL'ARGOMENTO
Cos'è la simulazione Monte Carlo?
La simulazione Monte Carlo è un insieme di algoritmi utilizzati per prevedere gli esiti probabilistici di un processo quando i suoi input variano in modo casuale. Nota anche come metodo Monte Carlo, analisi Monte Carlo o esperimento Monte Carlo, questa tecnica appartiene alla categoria delle simulazioni stocastiche.
Per comprendere la distribuzione dei possibili risultati, le simulazioni Monte Carlo eseguono un elevato numero di prove, ciascuna caratterizzata da un diverso insieme di input casuali. I risultati ottenuti da ogni prova vengono quindi analizzati per determinare la distribuzione di probabilità delle variabili incerte.
Il concetto di simulazione Monte Carlo nacque nell'ambito del Progetto Manhattan e dei successivi programmi di sviluppo delle armi nucleari. Nel 1946, Stanislaw Ulam e John von Neumann cercavano di determinare la distribuzione di probabilità dell'energia rilasciata a seguito della collisione tra un neutrone un nucleo atomico. Un collega suggerì il nome "Monte Carlo" perché suo zio era un giocatore d'azzardo del casinò di Monte Carlo, nel Principato di Monaco, e la selezione casuale delle variabili di input ricordava la casualità della roulette.
La maggior parte dei processi è deterministica, poiché ad ogni insieme di input corrispondono output noti. Ad esempio, se si aggiunge una quantità nota di calore a una quantità nota di acqua a una temperatura nota, è possibile calcolare l'aumento di temperatura risultante. Tuttavia, prevedere gli esiti di un sistema più complesso, in cui gli input sono casuali e il processo stesso è complesso, risulta molto più difficile. Per questo motivo, ingegneri, scienziati, matematici ed economisti utilizzano le simulazioni Monte Carlo per incorporare la casualità nelle previsioni relative a tali sistemi.
Esempio di simulazione Monte Carlo in Microsoft Excel
Un buon modo per comprendere la potenza di questo strumento di simulazione è osservare un esempio semplice. Un classico problema consiste nel prevedere quante volte il lancio di quattro monete produrrà zero, una, due, tre o quattro teste.
La variabile di input è il numero di monete, mentre la variabile di output che si desidera prevedere è la probabilità di ciascuna combinazione di teste. Una semplice simulazione Monte Carlo in Excel utilizza la funzione casuale RAND() per prevedere testa o croce, impostando una cella a uno (testa) se il numero casuale è inferiore a 0,5 e a zero (croce) se è superiore a 0,5. Il modello è costituito da una tabella con una colonna per ogni moneta; una riga per ogni prova; una colonna di somma per calcolare quante monete hanno mostrato testa. Per calcolare le probabilità, il modello utilizza la funzione COUNTIF() per contare il numero di volte in cui si verifica ciascun risultato, dividendo poi tale valore per il numero totale di prove.
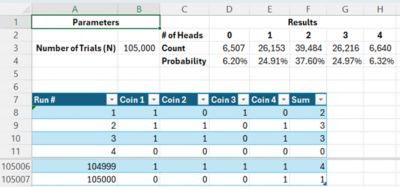
Una semplice simulazione Monte Carlo con quattro monete in Microsoft Excel. I risultati sono mostrati nella parte superiore dell'immagine, mentre le formule utilizzate sono riportate nella parte inferiore. Ogni volta che il foglio di calcolo viene aggiornato, viene generato un nuovo risultato.
Come eseguire una simulazione Monte Carlo
Le simulazioni Monte Carlo utilizzano algoritmi per risolvere problemi effettuando campionamenti da un ampio insieme di input casuali. Chi utilizza questo strumento deve definire il processo da simulare, identificare input e output, eseguire la simulazione e analizzarne i risultati.
Di seguito sono riportati i passaggi principali.
1. Comprendere il processo
La simulazione inizia definendo il processo da modellare. Può trattarsi di un problema fisico; il mercato azionario; le condizioni meteorologiche di una determinata regione o un processo biologico.
2. Definire le variabili indipendenti e la loro distribuzione
Il passaggio successivo consiste nell'identificare tutte le variabili indipendenti. Si tratta delle caratteristiche del processo rappresentate da variabili che, modificandosi, influenzano il comportamento del sistema. Le variabili indipendenti sono chiamate anche variabili di input, valori di input o semplicemente input.
In questa fase occorre definire il valore minimo e massimo di ciascuna variabile; la distribuzione, ovvero la variabilità, all'interno di tale intervallo. Esistono diversi tipi di distribuzione. Le più comuni sono le seguenti.
- Distribuzione uniforme: qualsiasi valore all'interno dell'intervallo specificato ha la stessa probabilità di verificarsi rispetto agli altri, generando una distribuzione uniforme.
- Distribuzione normale: in natura e nella finanza, i valori tendono a concentrarsi attorno a una media centrale. La probabilità diminuisce all'aumentare della distanza dalla media. Questa distribuzione è detta normale. Molti la chiamano curva a campana perché la sua rappresentazione grafica ricorda la forma di una campana.
- Distribuzione triangolare: quando i dati reali sono limitati, come spesso accade nella gestione dei progetti, gli ingegneri utilizzano il valore minimo, il valore più probabile e il valore massimo per costruire una distribuzione triangolare anziché una curva a campana. In questo caso, il valore più probabile non coincide necessariamente con la media.
- Distribuzione binomiale: quando una variabile di input può assumere soltanto due valori possibili (0 o 1, sì o no, vero o falso, testa o croce, ecc.), si utilizza una distribuzione binomiale.
- Distribuzione di Poisson: la distribuzione di Poisson descrive parametri di input che possono assumere due stati, tenendo però conto della frequenza con cui un determinato valore si presenta nel tempo. Un esempio tipico è il numero di visite a un negozio.
- Distribuzione empirica: Nei sistemi complessi, la distribuzione di una determinata variabile di input può non seguire nessuna delle distribuzioni standard. Tuttavia, se sono disponibili dati storici sufficienti per descriverne l'andamento, è possibile utilizzare una distribuzione empirica o personalizzata.
3. Definire le variabili dipendenti
Il terzo passaggio consiste nel definire le variabili dipendenti del processo. Si tratta di caratteristiche misurabili che cambiano al variare delle variabili di input. Le variabili dipendenti dovrebbero inoltre rappresentare metriche rilevanti per chi deve prendere decisioni. Negli studi di ottimizzazione, l'obiettivo è minimizzare o massimizzare una variabile dipendente. In alternativa, i team utilizzano i possibili risultati per supportare il processo decisionale. Le variabili dipendenti sono anche chiamate variabili di output, valori di uscita o valori dei risultati.
4. Creare una simulazione del processo
Il passaggio più importante consiste nel creare una rappresentazione accurata del processo sotto forma di algoritmo informatico. Può trattarsi di una semplice equazione, una tabella di ricerca o una rappresentazione più complessa mediante un modello numerico. La simulazione dovrebbe essere eseguita nel modo più rapido ed efficiente possibile.
5. Eseguire ripetutamente le simulazioni con un insieme casuale di variabili di input
La simulazione Monte Carlo vera e propria consiste nell'eseguire un elevato numero di prove utilizzando il modello di simulazione. L'algoritmo utilizza l'intervallo di valori e la distribuzione associata a ciascun input per generare valori casuali per ogni variabile di input. Lo strumento registra quindi i diversi risultati ottenuti da ciascuna prova.
Il numero di simulazioni richieste per ottenere una distribuzione accurata dei valori di output dipende dal processo analizzato. Alcuni problemi richiedono da 1.000 a 10.000 esecuzioni. Altri processi, invece, possono richiedere 100.000 prove o più.
6. Analizzare le variabili di output
Una volta raccolti tutti i valori di output, il passaggio successivo consiste nell'applicare metodi statistici per stimare la probabilità di ciascun risultato. Se la variabile di output segue una distribuzione normale, i valori di media e deviazione standard rappresentano la distribuzione di probabilità. Nei casi più semplici, la probabilità di un determinato valore corrisponde al numero di occorrenze di quel risultato diviso per il numero totale di prove.
Per sistemi e applicazioni più complessi, in particolare nell'addestramento dei modelli di apprendimento automatico (machine learning), gli analisti ricorrono all'analisi bayesiana.
Applicazioni tipiche della simulazione Monte Carlo nei diversi settori industriali
Le simulazioni Monte Carlo vengono utilizzate per la modellazione probabilistica in un'ampia gamma di settori. Di seguito sono riportate alcune delle applicazioni più comuni.
Ingegneria
Gli ingegneri utilizzano i metodi Monte Carlo in numerosi ambiti, poiché spesso devono progettare sistemi complessi per i quali non esistono dati storici o modelli deterministici semplici. Oltre alla progettazione, questa tecnica viene impiegata anche nella gestione dei progetti per eseguire analisi di sensibilità, valutare i rischi e supportare la pianificazione delle attività. L'applicazione più comune riguarda le simulazioni numeriche di sistemi complessi, utilizzate per comprendere il comportamento statistico di un prodotto e la relazione tra variabili di input e di output. Uno degli esempi più significativi è il trasporto neutronico, in cui gli ingegneri calcolano come i neutroni attraversano e interagiscono con i componenti strutturali di un reattore nucleare.
Petrolio, gas e attività minerarie
L'estrazione delle risorse naturali dal sottosuolo richiede la valutazione della sostenibilità economica di un progetto in presenza di numerose incognite. Il settore utilizza le simulazioni Monte Carlo per prevedere le dimensioni dei giacimenti, la porosità delle formazioni geologiche, la qualità delle risorse estratte e il prezzo futuro della materia prima. Uno degli impieghi più diffusi consiste nella modellazione geologica di un potenziale giacimento petrolifero mediante distribuzioni probabilistiche che descrivono la composizione delle rocce; la porosità; lo spessore dei diversi strati e la distribuzione del petrolio associata a ciascuna combinazione di parametri. Successivamente viene eseguita una simulazione Monte Carlo per ottenere una distribuzione delle possibili concentrazioni di petrolio. Anziché prevedere l'esatta quantità di petrolio presente in una determinata area, si calcola la distribuzione probabilistica delle riserve potenziali.
Mercati finanziari
Poche realtà al mondo presentano un livello di complessità e casualità superiore a quello dei mercati finanziari. Economisti e analisti finanziari utilizzano i metodi Monte Carlo per prevedere i prezzi delle azioni; la volatilità dei mercati; i tassi di interesse; i prezzi al consumo e altre importanti variabili economiche. I trader di materie prime utilizzano il metodo Monte Carlo per effettuare stress test sull'andamento nel tempo del prezzo di una commodity in loro possesso. Essi modellano la sensibilità del prezzo rispetto a decine di fattori di mercato e utilizzano successivamente una selezione casuale di eventi nel tempo per ottenere una distribuzione dei possibili prezzi per ciascun giorno. Il risultato è una misura del Value at Risk (VaR) del loro portafoglio.
Fisica, chimica e biotecnologia
Il metodo Monte Carlo è stato inizialmente sviluppato per la fisica nucleare e continua a rappresentare un elemento fondamentale nella modellazione delle radiazioni in sistemi quali reattori nucleari, terapie radiologiche e dispositivi di rilevamento. I chimici lo utilizzano come base della chimica computazionale e della meccanica statistica per modellare reazioni chimiche o sviluppare nuove molecole, poiché i meccanismi studiati sono troppo complessi per essere calcolati analiticamente. Lo stesso vale per le biotecnologie, dove i ricercatori impiegano questo metodo per interpretare i risultati delle sperimentazioni farmacologiche, valutare i tassi di risposta dei pazienti e progettare nuovi farmaci.
Un'applicazione comune del metodo Monte Carlo nella scoperta di farmaci è la simulazione di docking molecolare. I chimici cercano di individuare una piccola molecola (la chiave) che si inserisca in una proteina (la serratura). Se la molecola si adatta alla proteina, può inibire reazioni chimiche indesiderate. Invece di modellare ogni possibile forma e rotazione della piccola molecola, una distribuzione casuale di entrambe consente di individuare le combinazioni a più bassa energia, sulle quali i ricercatori possono poi concentrare la propria attenzione.
Vantaggi e svantaggi del metodo Monte Carlo
Le simulazioni Monte Carlo sono utilizzate in numerose applicazioni grazie ai loro vantaggi. Tuttavia, questo approccio presenta anche alcuni svantaggi che meritano di essere considerati prima di applicarlo a un problema reale.
Di seguito sono riportati i principali vantaggi e svantaggi.
Vantaggi
- Consente di modellare problemi complessi.
- Genera risultati probabilistici.
- Fornisce informazioni di sensibilità sulle variabili di input, indicando quanto una variazione di tali variabili influisca sul valore delle variabili di output.
- Tiene conto della distribuzione degli input.
Svantaggi
- Richiede notevoli risorse computazionali per sistemi complessi con numerose variabili di input e output e modelli numerici particolarmente sofisticati.
- È fortemente influenzato dalla qualità dei dati in ingresso (garbage in, garbage out).
- Può generare una falsa impressione di precisione, poiché produce una grande quantità di informazioni statistiche. Tuttavia, le distribuzioni calcolate sono affidabili solo quanto i parametri di input e l'accuratezza del modello utilizzato.
- Comporta un processo laborioso, a causa del tempo necessario per creare e verificare un modello accurato.
Strumenti utilizzati per la simulazione Monte Carlo
In generale, esistono tre categorie di strumenti per eseguire simulazioni Monte Carlo: software matematici, programmi personalizzati e software di simulazione.
Ciascuna categoria presenta vantaggi e criticità specifiche.
Software matematici
Strumenti come Microsoft Excel, Google Sheets, Mathematica e MATLAB sono molto potenti per eseguire calcoli e gestire le distribuzioni statistiche delle variabili di input e output. I fogli di calcolo non dispongono di funzionalità Monte Carlo dedicate; pertanto, gli utenti devono costruire le simulazioni da zero. Gli strumenti matematici specializzati, soprattutto quelli dotati di moduli statistici avanzati, semplificano la creazione di variabili casuali, automatizzano l'esecuzione delle prove e consentono di effettuare analisi probabilistiche dei risultati. La principale difficoltà di questa categoria di strumenti consiste nella realizzazione di un modello accurato del processo da analizzare.
Programmi personalizzati
I programmi personalizzati rappresentano una buona soluzione quando il processo può essere descritto mediante sottoprogrammi sviluppati in un linguaggio di programmazione. La maggior parte dei linguaggi dispone di librerie che supportano attività come la creazione delle distribuzioni di input delle variabili casuali e l'elaborazione delle variabili dipendenti risultanti. Lo svantaggio di questo approccio è che l'utente deve sviluppare un programma specifico per ogni applicazione, inclusa la modellazione del processo oggetto di studio. Piattaforme di programmazione come Python rendono questa attività più semplice, ma l'impostazione e il debug della simulazione possono comunque richiedere tempo.
Software di simulazione
L'insieme di strumenti più potente, e il più utilizzato nelle applicazioni reali, è costituito dai software di simulazione. Questi programmi modellano il processo da studiare e spesso includono strumenti integrati che semplificano l'impostazione delle simulazioni Monte Carlo e automatizzano l'esecuzione dei casi di prova.
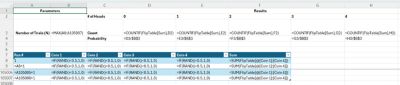
Un ottimo esempio è rappresentato dalla suite Ansys Optics: Ansys Zemax OpticStudio, software per la progettazione e l'analisi di sistemi ottici, utilizzato per simulazioni Monte Carlo di sistemi ottici, e Ansys Lumerical, progettato per analizzare il comportamento altamente stocastico tipico della fotonica. Entrambi gli strumenti consentono agli utenti di creare modelli parametrici compatibili con le simulazioni Monte Carlo.
L'interfaccia di ottimizzazione del software Ansys Lumerical
Lo stesso vale per i principali strumenti di simulazione Ansys: Ansys Mechanical, software di analisi strutturale agli elementi finiti; Ansys LS-DYNA/LS-Opt, software di simulazione strutturale per dinamica non lineare; Ansys Fluent, software di simulazione fluidodinamica; Ansys Maxwell, solver avanzato per campi elettromagnetici; Ansys HFSS, software di simulazione elettromagnetica ad alta frequenza. Ciascuno di questi strumenti è specializzato nella simulazione di uno specifico insieme di fenomeni fisici. Tutti supportano la parametrizzazione delle variabili di input e output, mettono a disposizione strumenti per simulazioni Monte Carlo e consentono elaborazioni statistiche dei risultati.
Quando gli strumenti integrati di una determinata piattaforma di simulazione non sono sufficienti, gli utenti possono integrarli con strumenti di ottimizzazione come Ansys optiSLang, software per l'integrazione dei processi e l'ottimizzazione della progettazione. Questo strumento di uso generale possiede funzionalità native particolarmente efficaci per l'esecuzione di simulazioni Monte Carlo e si integra sia con i software Ansys (ora parte di Synopsys) sia con strumenti di simulazione di terze parti, offrendo una piattaforma unica e automatizzata. Inoltre, sfrutta una robusta interfaccia Python che consente il collegamento con altri software o routine sviluppate in Python.
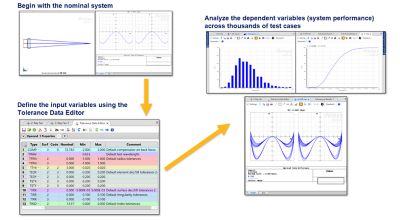
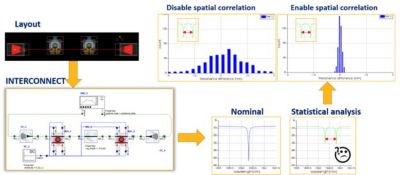
L'interfaccia di analisi delle tolleranze Monte Carlo del software Ansys Zemax OpticStudio per la progettazione e l'analisi di sistemi ottici
Intelligenza artificiale (AI)
Ricercatori e matematici utilizzano da tempo le simulazioni Monte Carlo in numerose applicazioni dell'intelligenza artificiale. Alcuni esempi includono:
- Machine learning per addestramento, ottimizzazione, analisi bayesiana e valutazione dell'affidabilità dei risultati.
- Monte Carlo Tree Search per processi decisionali su larga scala.
- Apprendimento per rinforzo (reinforcement learning).
- Addestramento di reti neurali.
- Perfezionamento dei modelli linguistici di grandi dimensioni (LLM).
La piattaforma cloud Ansys SimAI per simulazioni basate sull'intelligenza artificiale rappresenta un valido esempio di strumento moderno che utilizza simulazioni Monte Carlo per generare dati di addestramento destinati ai modelli di AI.
Risorse correlate
Cominciamo
Se devi affrontare sfide di progettazione, il nostro team è a tua disposizione per assisterti. Con una vasta esperienza e un impegno per l'innovazione, ti invitiamo a contattarci. Collaboriamo per trasformare i tuoi ostacoli ingegneristici in opportunità di crescita e successo. Contattaci oggi stesso per iniziare la conversazione.