-
-
Software gratuito per studenti
Ansys potenzia la nuova generazione di ingegneri
Gli studenti hanno accesso gratuito a software di simulazione di livello mondiale.
-
Connettiti subito con Ansys!
Progetta il tuo futuro
Connettiti a Ansys per scoprire come la simulazione può potenziare la tua prossima innovazione.
Paesi e regioni
Customer Center
Supporto
Partner Community
Contatta l'ufficio vendite
Per Stati Uniti e Canada
Accedi
Prove Gratuite
Prodotti & Servizi
Scopri
Chi Siamo
Back
Prodotti & Servizi
Back
Scopri
Ansys potenzia la nuova generazione di ingegneri
Gli studenti hanno accesso gratuito a software di simulazione di livello mondiale.
Back
Chi Siamo
Progetta il tuo futuro
Connettiti a Ansys per scoprire come la simulazione può potenziare la tua prossima innovazione.
Customer Center
Supporto
Partner Community
Contatta l'ufficio vendite
Per Stati Uniti e Canada
Accedi
Prove Gratuite
DETTAGLI DELL'ARGOMENTO
Cos'è un diagramma di Ashby?
I diagrammi di Ashby, noti anche come grafici di Ashby, sono ampiamente utilizzati in ingegneria, progettazione meccanica, scienza dei materiali, chimica e in tutti gli ambiti in cui i materiali rivestono un ruolo centrale. Prendono il nome dal Professor Michael Ashby dell'Università di Cambridge, che li ha sviluppati.
Nel modo più semplice, i diagrammi di Ashby sono grafici a dispersione 2D che rappresentano una proprietà del materiale sull'asse x un'altra proprietà del materiale sull'asse y. Ciò consente di valutare i trade-off tra diverse proprietà dei materiali e altri parametri di sviluppo, come il costo, nella selezione del materiale per una specifica applicazione. In sostanza, sono uno strumento per confrontare diversi fattori e proprietà nella scelta di un materiale che deve soddisfare un determinato scopo. I diagrammi di Ashby possono essere utilizzati per confrontare qualsiasi tipo di materiale. Mentre i grafici 3D sono difficili da interpretare, nei diagrammi 2D è possibile usare il colore per rappresentare ulteriori proprietà.
Possono essere impiegati in qualsiasi settore in cui le proprietà dei materiali (meccaniche, termiche, fisiche, elettriche, ambientali, ecc.) sono fondamentali per un prodotto. Proprio perché non sono vincolati a un settore specifico, i diagrammi di Ashby rappresentano strumenti estremamente versatili per gli ingegneri. Alcuni ambiti in cui i diagrammi di Ashby sono ampiamente utilizzati includono i settori automobilistico, aerospaziale, della tecnologia di consumo, della produzione di energia, edilizia e della ricerca accademica.
Tipologie comuni di diagrammi di Ashby
Tutti i diagrammi di Ashby fungono da strumenti visivi per la selezione e lo screening dei materiali, permettendo agli ingegneri di analizzare diverse combinazioni di proprietà. In molti casi, il materiale più avanzato o più diffuso non viene scelto, perché fattori come costi o vincoli applicativi ne limitano l'idoneità. Nei diagrammi di Ashby si compie quindi un compromesso tra le proprietà necessarie e altri fattori, quali la geometria del materiale, la disponibilità del materiale, la sostenibilità e il costo. Il materiale più adatto, che presenta il miglior compromesso tra tutti questi fattori, è quello che viene poi scelto.
Spesso i diagrammi utilizzano colori per distinguere le classi di materiali, come compositi, polimeri, metalli, leghe, leghe ad alta entropia, materiali naturali, ceramiche non tecniche o ceramiche tecniche.
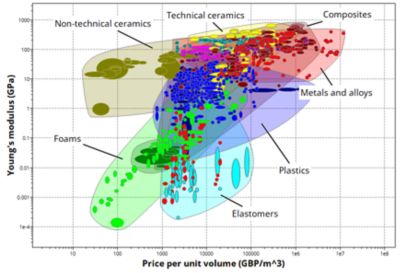
Esempio di diagramma di Ashby che mostra un trade-off tra resistenza (modulo di Young) e costo (prezzo per unità di volume)
I diagrammi di Ashby possono essere utilizzati durante il processo di progettazione per migliorare le prestazioni di un componente esistente individuando un materiale più adatto, oppure per selezionare il materiale ideale per una nuova applicazione.
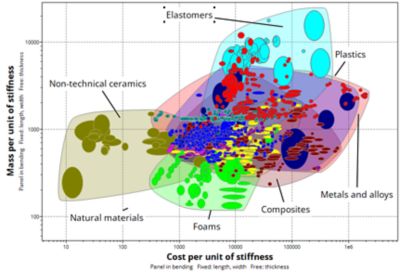
Esempio di diagramma di Ashby che utilizza indicatori di prestazione per un pannello in flessione, per identificare i materiali più leggeri e/o più economici per questa applicazione.
Sebbene sia possibile confrontare due proprietà qualsiasi dei materiali (spesso una qualche forma di resistenza, costo, impatto ambientale o leggerezza), alcuni esempi comuni includono:
- Densità vs. modulo di Young
- Modulo di Young vs. costo
- Resistenza allo snervamento vs. tenacità alla frattura
- Impatto ambientale vs. una proprietà del materiale
- Densità vs. temperatura massima di esercizio
Come usare i diagrammi di Ashby per scegliere il materiale giusto
I diagrammi di Ashby fanno parte della metodologia di selezione di Ashby, incentrata sulla scelta dei materiali. Questo approccio parte dall'analisi dell'intero insieme dei materiali disponibili, per poi restringere progressivamente il campo in base a requisiti e vincoli specifici.
Per ridurre le opzioni, gli ingegneri devono scomporre i requisiti progettuali dell'applicazione, ponendosi domande quali:
- Cosa si sta progettando?
- Qual è la funzione del prodotto?
- Quali carichi deve sopportare?
- Quali tolleranze sono richieste?
- Deve resistere ad alte temperature?
- Deve essere resistente ad agenti corrosivi?
- Quali sono i vincoli geometrici?
- L'impronta di carbonio è importante?
Queste domande relative alla progettazione aiutano a individuare le proprietà fondamentali del materiale, definire i requisiti imprescindibili e capire dove è possibile accettare compromessi.
Una volta stabiliti gli obiettivi, i materiali vengono vagliati in base ai vincoli e alle proprietà "indispensabili" per restringere la scelta. I materiali che non soddisfano questi criteri vengono esclusi, mentre quelli rimanenti vengono confrontati e classificati in base al loro potenziale (inclusi fattori come il costo). Il diagramma di Ashby risultante mostra quindi solo i materiali ancora "in gara". Le proprietà dei materiali sono generalmente rappresentate come insiemi (tenendo conto della variabilità tipica delle prestazioni), non come valori singoli. Per questo motivo, ogni materiale appare spesso come una "bolla", che rappresenta l'insieme delle sue proprietà.
Per obiettivi semplici, uno o due diagrammi di Ashby, insieme ad altri vincoli, sono spesso sufficienti per prendere una decisione. Tuttavia, nelle applicazioni più complesse, è necessario considerare più obiettivi simultaneamente (ad esempio, una specifica geometria sotto determinate condizioni di carico). In questi casi, si utilizzano più diagrammi di Ashby oppure diagrammi più complessi basati su indicatori di prestazione.
Metodologia degli indicatori di prestazione (Performance Index Methodology)
Per applicazioni più complesse o specifiche, i diagrammi di Ashby più semplici spesso non sono sufficienti. In questi casi è necessario utilizzare un indicatore di prestazione. Un indicatore di prestazione non è una singola proprietà rappresentata su uno degli assi del diagramma, ma una combinazione matematica di più proprietà del materiale, che consente di analizzare contemporaneamente diversi fattori prestazionali utilizzando un unico asse del grafico. Questo approccio semplifica la rappresentazione visiva quando si ha a che fare con più obiettivi, perché integra diversi parametri in un unico grafico, facilitando l'individuazione del materiale più adatto.
Alcuni esempi semplici di indicatori di prestazione includono pannelli in flessione, colonne sottoposte a compressione e alberi in torsione. Prendendo come esempio un pannello in flessione, esistono variabili libere che possono cambiare durante la progettazione, come lo spessore del pannello, che dipende dalle prestazioni richieste. Allo stesso tempo, è necessario identificare anche le variabili fisse, cioè quelle che non possono essere modificate. Ad esempio, la lunghezza e la larghezza del pannello, che devono rispettare vincoli dimensionali.
Una volta definiti questi aspetti, è possibile identificare i vincoli limitanti. Questi riguardano il comportamento del materiale, come un progetto limitato dalla rigidezza, che non deve superare una certa deformazione, oppure un progetto limitato dalla resistenza, che non deve cedere sotto un determinato carico. I vincoli servono a determinare se un materiale fallirà in determinate condizioni e a selezionare quelli che garantiscono prestazioni adeguate.
Tutti questi fattori vengono incorporati nell'indicatore di prestazione, consentendo agli ingegneri di confrontare e classificare materiali e classi di materiali per ottimizzare il progetto in scenari specifici. L'indice di prestazione tiene quindi conto, almeno in parte, anche della geometria e delle condizioni di carico. Ciò significa che, invece di indicare semplicemente il "materiale più economico", l'indice fornisce "il pannello in flessione più economico in un progetto limitato dalla rigidezza", in base ai vincoli definiti. Ad esempio: un metallo può consentire di realizzare un componente più sottile, ma una plastica più spessa potrebbe risultare complessivamente più leggera e quindi più vantaggiosa in alcune applicazioni. Sebbene gli indicatori di prestazione possano essere derivati o calcolati manualmente per ogni scenario, oggi il modo più rapido ed efficace per utilizzarli è attraverso software dedicati, che includono indici predefiniti facilmente selezionabili e applicabili a un'ampia gamma di scenari ingegneristici.
Caso di studio con Ashby Plot: individuazione del materiale corretto nelle applicazioni automobilistiche
Esistono numerose situazioni e materiali diversi che possono essere valutati a seconda dell'applicazione. Di seguito viene riportata una tipica procedura seguita da un ingegnere di Ansys, part of Synopsys, per determinare quali nuovi materiali potessero sostituire un materiale esistente al fine di migliorarne le prestazioni. In questo esempio, si cercava un nuovo materiale per una traversa automobilistica che sostituisse l'attuale lega di alluminio 357 colata in sabbia. Sebbene la traversa in alluminio fosse adeguata, gli ingegneri hanno valutato la possibilità di individuare un materiale più leggero, così da ridurre il peso del componente e, di conseguenza, l'impatto ambientale complessivo del veicolo.
Per avviare il processo di selezione, la traversa è stata approssimata a una trave sollecitata a flessione. Le variabili fisse e libere sono state definite come segue: la lunghezza e la forma della trave non potevano essere modificate, mentre l'area della sezione trasversale poteva essere adattata, se necessario.
Il vincolo principale per una traversa automobilistica è la resistenza: il materiale doveva essere sufficientemente robusto da sopportare i carichi senza cedere. Anche la massa rappresentava un obiettivo chiave. Il primo diagramma di Ashby utilizzava due indici di prestazione: sull'asse Y era riportata la massa per unità di resistenza (per una trave in flessione), mentre sull'asse X era riportato il costo per unità di resistenza (per una trave in flessione). Da questa analisi iniziale sono emerse numerose famiglie di materiali potenzialmente adatte, tra cui ceramiche tecniche, metalli e leghe metalliche, ceramiche non tecniche. Alcuni materiali risultavano più spessi ma leggeri, altri più sottili ma pesanti, a seconda della loro densità.
In questa fase, tuttavia, non era stato ancora escluso alcun materiale, generando un elenco poco utilizzabile per un'applicazione automobilistica. Infatti, sebbene alcuni materiali fossero teoricamente validi dal punto di vista del rapporto massa/resistenza o costo/resistenza, materiali come legno e calcestruzzo non sono adatti al settore automobilistico. Applicando vincoli realistici, i materiali non praticabili sono stati eliminati, lasciando solo quelli idonei. Per la traversa automobilistica, i vincoli di esempio includevano proprietà meccaniche adeguate, funzionamento in un ampio intervallo di temperatura (da -40 a 100 °C) e resistenza accettabile sia all'acqua dolce che a quella salata.
Dopo l'applicazione di questi criteri, i materiali posizionati nella parte inferiore del diagramma di Ashby risultavano i più leggeri, ma tendevano anche a essere più costosi, come i compositi in fibra di carbonio. I materiali sul lato sinistro del diagramma erano i più economici, ma anche i più pesanti. Per trovare un compromesso tra basso peso e costo contenuto, si è scoperto che i polimeri PA66 (Nylon 66) rinforzati con fibra di vetro potevano rappresentare un'ottima alternativa, soddisfacendo tutti i requisiti. Questo candidato è stato quindi sottoposto a ulteriori analisi, simulazioni e test fisici.
La fonte dei dati utilizzati nel grafico è stata il database Ansys MaterialUniverse, un archivio proprietario contenente migliaia di materiali ingegneristici con informazioni complete e comparabili, particolarmente adatto alla selezione dei materiali e/o agli indicatori di prestazione nei diagrammi di Ashby.
Limiti dei diagrammi di Ashby
Sebbene l'uso dei diagrammi di Ashby offra numerosi vantaggi, non è un metodo perfetto. Come ogni metodo analitico, i diagrammi di Ashby presentano alcuni limiti:
- Non è possibile confrontare simultaneamente più di due o tre fattori in un singolo grafico: per analisi più complesse è necessario creare più grafici e confrontarli tra loro
- Si tratta di un metodo visivo che non restituisce una risposta univoca o il "miglior" materiale, ma individua famiglie o insiemi di candidati da analizzare più approfonditamente. La valutazione ingegneristica resta fondamentale: ogni organizzazione deve stabilire l'importanza relativa dei compromessi (ad esempio, quanto aumento di costo sia accettabile per migliorare le prestazioni)
- I diagrammi di Ashby devono essere utilizzati insieme ad altre ricerche e criteri di selezione per determinare l'idoneità di un materiale
- I diagrammi di Ashby richiedono dati completi e comparabili: non è possibile tracciare un materiale se mancano i dati relativi a una proprietà. Per questo motivo, il database Ansys MaterialUniverse risulta particolarmente adatto a questo tipo di applicazioni
Software per diagrammi di Ashby
I diagrammi di Ashby possono essere generati utilizzando la suite Ansys Granta, dedicata alla gestione dei materiali, alla selezione e all'organizzazione dei dati. Include: Ansys Granta Selector, software per la selezione dei materiali, e Ansys Granta MI Enterprise, software per la gestione dei dati sui materiali. All'interno di Ansys Granta, i dati possono essere rappresentati graficamente ed etichettati, ed è possibile includere un numero illimitato di vincoli e requisiti per ridurre la selezione da decine di migliaia di materiali a poche opzioni (ad esempio 5-10) da analizzare in dettaglio.
Ansys Granta Selector è un software standalone, pensato per attività di selezione dei materiali. È una soluzione desktop Windows rivolta a progettisti, specialisti di simulazione ed esperti di scienza dei materiali. Ansys Granta MI è invece una soluzione di livello aziendale utilizzata dalle organizzazioni per gestire e archiviare dati sui materiali, oltre a eseguire ricerche e processi di selezione. Entrambi gli strumenti consentono di creare diagrammi di Ashby a partire dai dati disponibili.
Una volta selezionati i materiali, è possibile utilizzarli in diversi scenari applicativi simulandoli con altri strumenti Ansys, tra cuiAnsys Mechanical software per l'analisi strutturale agli elementi finiti, Ansys Discovery, software di simulazione di prodotti 3D, Ansys Maxwell, software di simulazione elettromagnetica avanzata, e Ansys HFSS, software di simulazione elettromagnetica ad alta frequenza. I dati possono essere esportati direttamente da Granta verso questi strumenti per analizzare in profondità i materiali candidati e individuare la soluzione migliore.
Se desideri saperne di più su come utilizzare i diagrammi di Ashby per scegliere il materiale più adatto (o il giusto insieme di materiali) per la tua applicazione, contattata i nostri esperti oggi stesso.
Risorse correlate
Cominciamo
Se devi affrontare sfide di progettazione, il nostro team è a tua disposizione per assisterti. Con una vasta esperienza e un impegno per l'innovazione, ti invitiamo a contattarci. Collaboriamo per trasformare i tuoi ostacoli ingegneristici in opportunità di crescita e successo. Contattaci oggi stesso per iniziare la conversazione.