Synopsys and Ansys power the future of innovation—connecting silicon to systems.
-
-
Accédez au logiciel étudiant gratuit
Ansys donne les moyens à la prochaine génération d'ingénieurs
Les étudiants ont accès gratuitement à un logiciel de simulation de classe mondiale.
-
Connectez-vous avec Ansys maintenant !
Concevez votre avenir
Connectez-vous à Ansys pour découvrir comment la simulation peut alimenter votre prochaine percée.
Espace client
Support
Communautés partenaires
Contacter le service commercial
Pour les États-Unis et le Canada
S'inscrire
Essais gratuits
Produits & Services
Apprendre
À propos d'Ansys
Back
Produits & Services
Back
Apprendre
Ansys donne les moyens à la prochaine génération d'ingénieurs
Les étudiants ont accès gratuitement à un logiciel de simulation de classe mondiale.
Back
À propos d'Ansys
Concevez votre avenir
Connectez-vous à Ansys pour découvrir comment la simulation peut alimenter votre prochaine percée.
Espace client
Support
Communautés partenaires
Contacter le service commercial
Pour les États-Unis et le Canada
S'inscrire
Essais gratuits
INFORMATIONS SUR LE SUJET
Qu'est-ce que la pondération A ?
La pondération A est une méthode courante de pondération de fréquence appliquée à tout son capté afin de le ramener à un niveau perceptible par l'oreille humaine. Les sons émis ont une large gamme de fréquences, et le son capté par un microphone est différent de ce qui est capté par l'oreille. Les oreilles humaines ne peuvent théoriquement entendre uniquement qu'entre 20 et 20 000 Hz et sont très sensibles aux fréquences comprises entre 250 à 5 000 Hz, tout en étant moins sensibles aux fréquences plus basses et plus élevées.
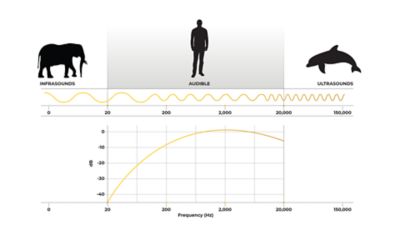
Étendue auditive humaine
Ainsi, en appliquant une pondération spécifique à chaque fréquence du son, le niveau sonore à cette fréquence reflète mieux la perception réelle de son intensité. Il existe différents types de pondération définis dans la norme internationale CEI 61672:2003 en fonction de la plage d'intensité sonore et de l'application visée, mais la pondération A est l'approche la plus couramment utilisée. La pondération A est essentiellement un filtre de fréquence qui couvre la plage de fréquences que nous pouvons entendre et elle permet de mesurer le niveau sonore en dB(A).
La pondération A dans le cadre de la mesure du bruit
Le niveau de pression acoustique (SPL) est traditionnellement mesuré sur une échelle en décibels (dB). Il s'agit de la quantité de pression exercée sur l'air par une onde sonore. L'équipement de mesure du son enregistre et indique une valeur dB(SPL) pour toutes les fréquences. La pondération A reflète l'impact relatif de chaque fréquence sur la perception de l'oreille humaine. Du moment où l'onde sonore entre dans notre oreille jusqu'à l'interprétation finale par notre cerveau comme un son, le système auditif agit comme un filtre naturel qui laisse plus d'espace à certaines fréquences et moins à d'autres.
Exemple de son à 1 000 Hz
Exemple de son à 100 Hz
Applications courantes de la pondération A
Bien qu'il existe de nombreux types de systèmes de pondération de fréquence, la pondération A est devenue la norme courante pour évaluer les dommages auditifs et les effets du bruit sur la santé, ainsi que pour mesurer de nombreux types de pollution sonore (tels que le bruit industriel ou environnemental).
Les domaines dans lesquels les mesures de bruit pondérées A sont largement utilisées sont les suivants :
- Bruit des moteurs électriques et des pompes dans le secteur de l'énergie
- Bruit, vibrations et secousses (NVH) des voitures dans l'industrie de l'automobile et des transports
- Bruit des drones, avions et hélicoptères dans les secteurs de l'aérospatiale et de la défense
- Niveaux sonores des chaînes de production
- Niveaux sonores dans la construction
- Niveaux sonores internes dans les bâtiments
- Bruits des produits de consommation, y compris les ventilateurs et les différents appareils de cuisine (réfrigérateurs, par exemple)
- Pollution sonore environnementale pour les citoyens et la faune sauvage (par exemple, à proximité des aéroports et des chemins de fer)
- Faible niveau de bruit des équipements audio
Différences entre dB et dB(A)
Par rapport aux mesures non pondérées en dB, les mesures pondérées en dB(A) reflètent davantage ce que l'on entend réellement. Cela signifie que deux sons peuvent avoir le même niveau de dB, mais des niveaux de dB(A) différents. Afin de garantir la satisfaction des clients lors du développement de produits ou de la conception de systèmes, on utilise la valeur pondérée A, car elle correspond au meilleur niveau de confort pour l'être humain. Dans les services de recherche et développement relevant de différents secteurs d'activité, l'échelle dB(A) est largement utilisée dans le cadre des spécifications et des réglementations internes. Par exemple, au sein de l'Union européenne, tous les véhicules doivent obtenir une certification attestant que le niveau sonore au passage ne dépasse pas les seuils fixés pour des conditions de fonctionnement et des positions de microphone spécifiques (en fonction du type de véhicule). Ces valeurs de mesure pour la certification sont souvent exprimées en dB(A).
Histoire de la pondération A
La pondération A existe depuis près d'un siècle et remonte aux recherches fondamentales menées par Harvey Fletcher et Wilden Munson en 1933 sur l'intensité du son perçue. La courbe de pondération A a été définitivement établie en 1936 lorsque les courbes isosoniques de Fletcher-Munson (également appelées courbes isosoniques) ont été publiées en tant que norme de l'American National Standards Institute (ANSI). Au fil du temps, ces courbes ont été mises à jour et publiées en tant que norme 226 de l'Organisation internationale de normalisation (ISO), dont la dernière version remonte à 2003 : ISO 226:2003. La norme CEI 61672:2003 définit désormais toutes les courbes utilisées dans les sonomètres, qui fournissent des mesures de fréquence pondérées allant de la pondération A à la pondération C (dB[C]).
Les courbes isosoniques de Fletcher-Munson illustrent la manière dont l'oreille humaine perçoit l'intensité sonore à différentes fréquences. Elles évaluent la sensibilité auditive à différents niveaux d'un son pur à la fréquence de référence de 1 000 Hz. La pondération A est basée sur la courbe isosonique inversée correspondant à 40 phons, c'est-à-dire l'intensité sonore perçue d'un son pur de 1 000 Hz à 40 dB(SPL). Cela équivaut à des sons modérément intenses. Par exemple, un son pur émis à 1 000 Hz à 40 dB(SPL) sera perçu comme aussi fort qu'un son pur de 50 dB(SPL) à 250 Hz ou 8 000 Hz, car ils ont le même niveau d'intensité sonore de 40 phons et, ce niveau constituant la courbe de base de la pondération A, le même niveau dB(A).
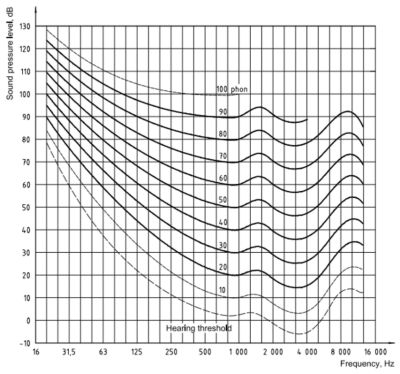
Exemple de courbes isosoniques
La pondération A pourrait correspondre davantage à la courbe isosonique inversée de 40 phons si elle présentait une pente raide au-delà de 10 kHz, mais pendant de nombreuses années, les filtres à pente raide étaient difficiles à fabriquer. Il existe aujourd'hui des filtres, tels que la courbe ITU-R 468, capables d'accentuer les fréquences comprises entre 1 et 9 kHz. Cependant, ils sont rarement intégrés dans les sonomètres et les méthodes standard de pondération A sont restées inchangées depuis des années.
Autres courbes de pondération de fréquence
La pondération A est devenue la méthode de pondération de fréquence la plus couramment utilisée. Elle est aujourd'hui utilisée dans de nombreux sonomètres. Outre la pondération A, la pondération B est également très répandue, mais les autres pondérations (la pondération C, la pondération D, la pondération G et la pondération Z) sont moins courantes. Le choix de la pondération à utiliser dépend de l'application et de l'intensité sonore. Si elle est très faible ou très élevée, une pondération différente qui correspondra mieux à la sensibilité de l'oreille humaine sera appliquée.
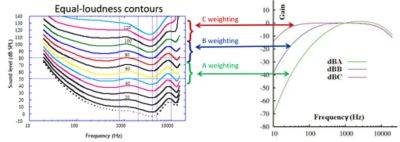
Représentation graphique des courbes isosoniques et des différentes méthodes de pondération de fréquence
Vous trouverez ci-dessous un aperçu général de la façon dont chaque méthode de pondération de fréquence est utilisée.
- Pondération A : utilisée pour le bruit modéré quotidien.
- Pondération B : correspond à la courbe isosonique de 70 phons, qui couvre les sons modérément forts. Elle peut être utilisée pour mesurer le bruit intérieur des véhicules, le bruit ambiant ou le bruit public.
- Pondération C : correspond à la courbe isosonique de 100 phons, qui englobe les sons très forts. En raison de sa forme plus plate, la pondération C est principalement utilisée sur les sonomètres pour mesurer le bruit à large bande, mais elle peut également servir à mesurer les bruits très forts émis par les engins de chantier.
- Pondération D : utilisée pour des applications spécifiques telles que la mesure du bruit des avions.
- Pondération G : utilisée pour les mesures dans la plage infrasonore qui ne peut être entendue par les oreilles humaines, telles que les sous-marins, les communications et le Wi-Fi.
- Pondération Z : également appelée « pondération zéro », car il s'agit d'une réponse en fréquence plate sans filtre.
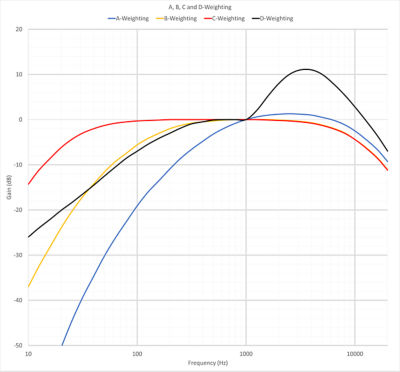
Représentation graphique des différentes courbes de pondération
Pondération A dans le cadre de la simulation
La simulation vibro-acoustique permet de simuler le bruit d'une source tant au niveau de la source qu'au niveau du système, afin d'évaluer l'impact de ce bruit sur le confort des êtres humains. La plupart des simulations sont effectuées en dB(SPL), puis filtrées a posteriori pour obtenir la valeur en dB(A). Voici quelques exemples du son qui peut être généré à l'aide de la simulation :
- Mouvement de deux pièces ou composants se rapprochant l'un de l'autre, comme les dents d'une boîte de vitesses, qui entraîne la génération d'un son.
- Mouvement d'autres composants qui génèrent du son.
- Bruit d'impact provenant de l'écrasement ou de la chute d'un objet.
- Mouvement d'un fluide dans un tuyau, un turbo, à l'intérieur d'un ventilateur ou à l'intérieur d'une cavité.
- Son d'un moteur électrique.
- Vibration de différents composants et leurs sorties de pression.
- Propagation des pressions sonores de la source à l'oreille ou à un autre point récepteur.
Toutes ces sources sonores peuvent être simulées à l'aide des outils Ansys, tels que les logiciels Ansys Mechanical, Ansys Motion, Ansys Fluent et Ansys LS-DYNA, puis analysées dans l'application Ansys Sound afin d'étudier comment la pondération A peut être appliquée à différents secteurs. L'utilisation de la simulation permet de développer des produits conformes aux réglementations sonores et à des niveaux sonores qui ne sont pas inconfortables pour l'utilisateur ou toute personne se trouvant à proximité.
Si vous souhaitez en savoir plus sur la façon dont vous pouvez utiliser des méthodes de simulation pour concevoir différents composants et produits sans que le bruit soit nocif pour vos clients, contactez notre équipe technique dès aujourd'hui.
Ressources connexes
Commençons
Si vous êtes confronté à des défis d'ingénierie, notre équipe est là pour vous aider. Forts de notre expérience et de notre engagement en faveur de l'innovation, nous vous invitons à nous contacter. Collaborons pour transformer vos obstacles techniques en opportunités de croissance et de réussite. Contactez-nous dès aujourd'hui pour entamer la conversation.