


ANSYS BLOG
June 27, 2023
Using Photoplethysmography (PPG) for Designing Optical Heart Rate Sensors
Photoplethysmography (PPG) is a low-cost, non-invasive optical technology that takes physiological measurements on the surface of the skin. It is the most commonly used measurement of heart rate for heart rate trackers. PPG devices consist of infrared or visible range light-emitting diodes (LEDs) and photodetectors. Because light is more strongly absorbed and scattered by the blood than by the surrounding tissue, this technique can also be used to detect blood volume changes in the tissue. One of its most widespread applications is the wearable optical heart rate sensor included in commercially available smart bands, sports bracelets, and watches that provide comfortable and continuous pulse monitoring during everyday tasks.
We'll demonstrate how to model human skin in Ansys Zemax OpticStudio for physiological measurements, illustrate how to simulate time-dependent PPG-based heart rate monitoring using the ZOS-API, and show you how to validate the overall design by analyzing motion and pressure effects on measurement accuracy using Ansys Speos, Ansys Workbench, and Ansys Mechanical.
Basic Heart Rate Sensor Design
PPG sensors can be used either in reflection or in transmission mode. As the penetration depth of the light depends on its wavelength, green and yellow LEDs are most suitable to take measurements in the superficial blood flow and are typically used in reflection mode. On the other hand, infrared and near-infrared wavelengths are better suited for measurements of deep-tissue blood flow and can also be used in transmission mode. In this example, we present a reflection PPG device, as shown in the image below.
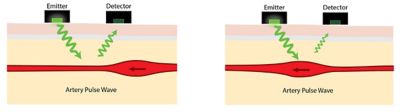
A reflection photoplethysmography device
Human Skin Model
To simulate light transport in tissue media, we can use a layered skin model, which accounts for the epidermis, the dermis, and subcutaneous fat. To model a PPG-based heart rate sensor and measure the changes caused by the pulsation of the blood, we focus on accurately describing the layers where this pulsation can be observed. Therefore, we separately model the sublayers of the dermis with different blood content values — namely the papillary dermis, subpapillary dermis, upper blood net dermis, reticular dermis, and deep blood net dermis.
On the other hand, as there is no blood content in the epidermis — to keep the model simple — we use only one thick epidermis layer, which accounts for all the stratum corneum, stratum granulosum, stratum spinosum, and stratum basale. Finally, similarly to most of the published skin models, we represent the subcutaneous fat with one single layer, too.
To start with a simplified structure and add more complexity to the model later, first, we can represent all the above-mentioned tissue layers as rectangular volumes in the Non-Sequential mode of OpticStudio. The thickness values of the layers are defined based on literature data, and the cross-sectional size is set in such a way that there is no light leakage at the sides. To ensure that subsequent layers are fitted next to each other without any air gaps, the previous layer is used as the Reference Object and the Z-position is determined by a Pickup solve from the Z-length value of the previous layer.

Customizing the Tissue Layers
This case study relies on data published in the literature, but since the optical parameters of human skin may vary significantly across populations, different parameters might be required for specific subject groups. If more accurate data is available for a specific application, then model parameters can be easily customized accordingly.
For the sake of simplicity, we do not represent all individual blood vessels in the skin, as it would require hundreds of additional objects with complex spatial arrangement and reduce the generality of the model. Instead, we take the blood content of the different skin layers into account by calculating the weighted average of the optical parameters of the blood and surrounding tissue.
Bulk Scattering in Tissue
Light scattering by small particles in turbid media, such as in biological tissues, can be accurately described by the Henyey-Greenstein distribution function, which has only one free parameter: its anisotropy factor g. The domain of this parameter is the [-1, 1] interval, in which g=-1 corresponds to backscattering, g=0 describes isotropic scattering, and g=1 represents forward scattering. The angular distribution of the scattered light is defined as:

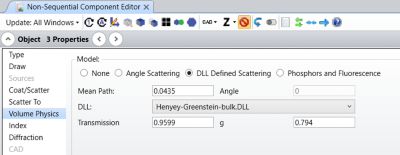
In the Non-Sequential mode of OpticStudio, the Henyey-Greenstein bulk scattering model is available as a bulk scatter DLL (Henyey-Greenstein-bulk.DLL). Further explanations of the model together with comprehensive analyses of the DLL are presented in the Knowledgebase article “Using the Henyey-Greenstein distribution to model bulk scattering.” A detailed discussion on the surface and bulk scattering models in OpticStudio can be found in this Knowledgebase article “What scattering models are available in OpticStudio?"
The input parameters of the Henyey-Greenstein scattering DLL in OpticStudio are the Mean Path, the Transmission fraction, and the g anisotropy parameter, while in the literature, the scattering and absorption coefficients (µs and µa, respectively) are typically published together with the anisotropy factor. Therefore, to set the scattering parameters of each layer in the model based on realistic data presented in the literature, we can use the following equations to convert the values:

As described before, the scattering and absorption coefficients, as well as the anisotropy factor of different skin layers, are calculated as the weighted average of the corresponding values for the blood and the rest of the tissue.
The multi-layered skin model and light transport in the tissue are shown in the 3D layout plots below. To illustrate the individual scattering events, rays are coloured by segments in the plots.
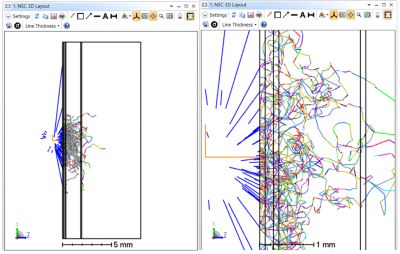
To provide numerical results in addition to the illustration, we add a Detector Rectangle object to the design, facing towards the skin, which represents a typical photodetector in PPG devices. This design can be used as a simple off-the-shelf skin model.
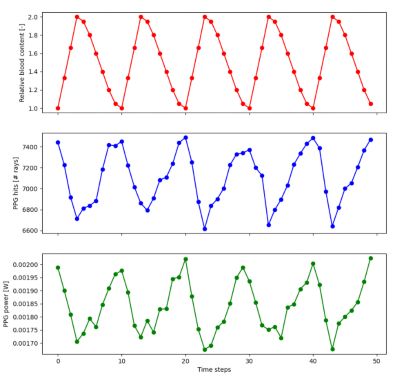
Heart Rate Sensor Simulation
In order to simulate heart rate monitoring, we can use the ZOS-API to mimic pulsating blood flow in the tissue. To do so, we consider temporal changes in the blood content of the layers by a multiplication factor, assuming the blood volume varies proportionally and simultaneously in each layer. We model the different phases of the cardiac cycle by adjusting the blood content of the skin layers, then examine the detected back-scattered light as a function of the time steps. In this example, we use the Python API — connected to OpticStudio via .NET — to modify the model parameters, run ray traces with the fine-tuned settings in OpticStudio, and analyze and plot the results.
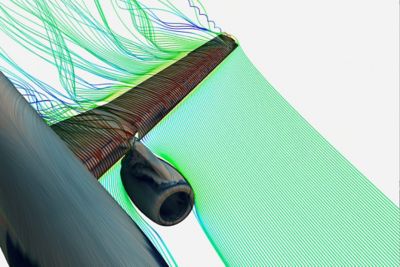
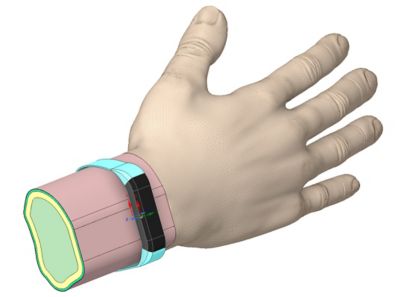
Real-World Arm and Smart Band Model
To take design one step further, we can also create a realistic arm and smart band model in Speos to analyze and effectively validate the entire optical system of human skin together with the PPG heart rate sensor. For this purpose, we build an accurate geometrical, structural representation of the arm and use the same multilayered optical description for skin tissue as before, relying on the Henyey-Greenstein scatter function.
We also create a computer-aided design (CAD) model of the smart watch that accounts for the strap and the watch itself, as well as the LED source and photodetector for the heart rate sensor. In order to analyze the photodetector signal, we use the Irradiance Sensor in Speos. To further investigate light propagation and the volumetric distribution within the tissue, we can add an extra 3D Energy Density Sensor.
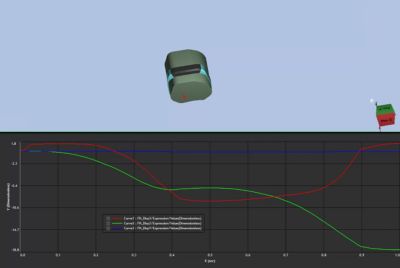
Analyzing Dynamic Effects on Measurement Accuracy
Finally, in this example, we also investigate the impact of nonstandard wearing methods on measurement accuracy, such as light leakage, incomplete fit, arm swing, and band movement on the skin. To understand motion effects, we perform dynamic simulations in Mechanical to calculate relative position changes between the wristband and the arm in various scenarios. Then, we evaluate the impact of these relative movements on heart rate measurements using optical simulations in Speos. To automate this workflow, we can leverage Workbench to automatically set up the modified scenarios and run the ray traces in Speos based on motion data acquired from Mechanical.
Furthermore, we can also explore how pressure from the smart watch affects optical measurements. To do so, we use Mechanical to analyze structural deformations on the arm due to increased pressure from the smart band in unconventional positions, then run ray traces in Speos again in those deformed states to quantify its effects. With this, we can validate the entire optical system design of the smart watch with practical examples in a real-world application.
To learn more about modeling human skin in OpticStudio and simulating heart rate monitoring using the ZOS-API, read our Knowledgebase article, How to model the human skin and optical heart rate sensors in OpticStudio.
See What Ansys Can Do For You
See What Ansys Can Do For You
Contact Us
Contact us today